Arapaho vs Soviet Union Disability Age Over 75
COMPARE
Arapaho
Soviet Union
Disability Age Over 75
Disability Age Over 75 Comparison
Arapaho
Soviet Union
49.8%
DISABILITY AGE OVER 75
0.0/ 100
METRIC RATING
291st/ 347
METRIC RANK
46.2%
DISABILITY AGE OVER 75
98.8/ 100
METRIC RATING
80th/ 347
METRIC RANK
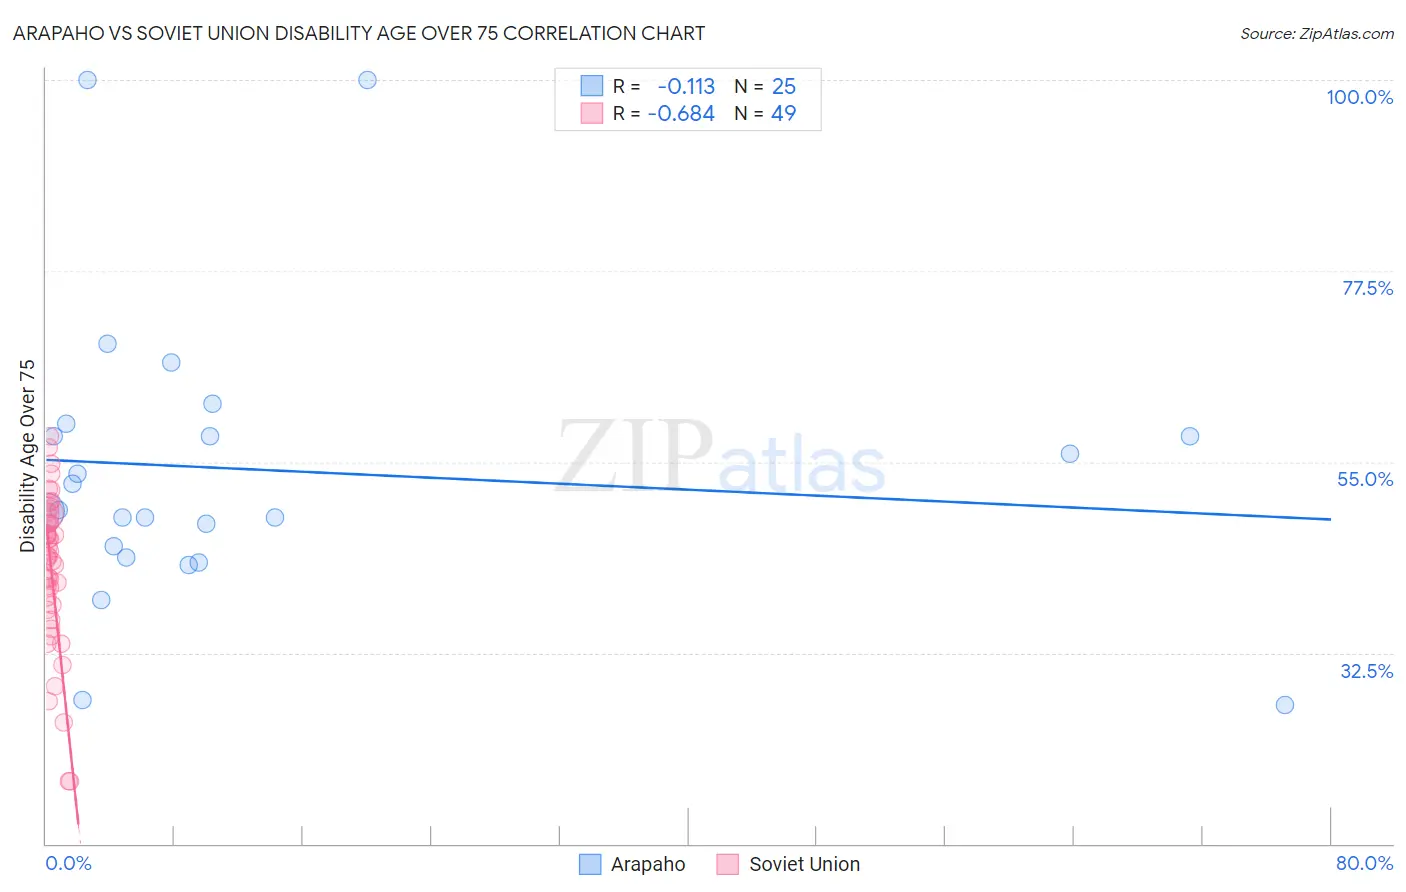
Arapaho vs Soviet Union Disability Age Over 75 Correlation Chart
The statistical analysis conducted on geographies consisting of 29,767,019 people shows a poor negative correlation between the proportion of Arapaho and percentage of population with a disability over the age of 75 in the United States with a correlation coefficient (R) of -0.113 and weighted average of 49.8%. Similarly, the statistical analysis conducted on geographies consisting of 43,492,822 people shows a significant negative correlation between the proportion of Soviet Union and percentage of population with a disability over the age of 75 in the United States with a correlation coefficient (R) of -0.684 and weighted average of 46.2%, a difference of 7.9%.
Disability Age Over 75 Correlation Summary
| Measurement | Arapaho | Soviet Union |
| Minimum | 26.3% | 17.4% |
| Maximum | 100.0% | 58.1% |
| Range | 73.7% | 40.7% |
| Mean | 54.0% | 42.4% |
| Median | 49.3% | 43.9% |
| Interquartile 25% (IQ1) | 44.4% | 37.9% |
| Interquartile 75% (IQ3) | 58.7% | 48.3% |
| Interquartile Range (IQR) | 14.4% | 10.4% |
| Standard Deviation (Sample) | 17.2% | 9.0% |
| Standard Deviation (Population) | 16.9% | 9.0% |
Similar Demographics by Disability Age Over 75
Demographics Similar to Arapaho by Disability Age Over 75
In terms of disability age over 75, the demographic groups most similar to Arapaho are Puget Sound Salish (49.8%, a difference of 0.0%), Osage (49.8%, a difference of 0.020%), Shoshone (49.9%, a difference of 0.070%), Yaqui (49.8%, a difference of 0.090%), and Sioux (49.7%, a difference of 0.14%).
| Demographics | Rating | Rank | Disability Age Over 75 |
| Immigrants | Latin America | 0.0 /100 | #284 | Tragic 49.5% |
| Crow | 0.0 /100 | #285 | Tragic 49.6% |
| Immigrants | Belize | 0.0 /100 | #286 | Tragic 49.6% |
| Sioux | 0.0 /100 | #287 | Tragic 49.7% |
| Yaqui | 0.0 /100 | #288 | Tragic 49.8% |
| Osage | 0.0 /100 | #289 | Tragic 49.8% |
| Puget Sound Salish | 0.0 /100 | #290 | Tragic 49.8% |
| Arapaho | 0.0 /100 | #291 | Tragic 49.8% |
| Shoshone | 0.0 /100 | #292 | Tragic 49.9% |
| Spanish American Indians | 0.0 /100 | #293 | Tragic 49.9% |
| Immigrants | Cambodia | 0.0 /100 | #294 | Tragic 50.0% |
| Spanish Americans | 0.0 /100 | #295 | Tragic 50.0% |
| Mexican American Indians | 0.0 /100 | #296 | Tragic 50.0% |
| Armenians | 0.0 /100 | #297 | Tragic 50.0% |
| Marshallese | 0.0 /100 | #298 | Tragic 50.1% |
Demographics Similar to Soviet Union by Disability Age Over 75
In terms of disability age over 75, the demographic groups most similar to Soviet Union are Swiss (46.2%, a difference of 0.0%), New Zealander (46.2%, a difference of 0.0%), Immigrants from Latvia (46.2%, a difference of 0.020%), Argentinean (46.2%, a difference of 0.020%), and Immigrants from Western Europe (46.2%, a difference of 0.040%).
| Demographics | Rating | Rank | Disability Age Over 75 |
| Cambodians | 99.1 /100 | #73 | Exceptional 46.1% |
| Egyptians | 99.0 /100 | #74 | Exceptional 46.1% |
| Serbians | 99.0 /100 | #75 | Exceptional 46.1% |
| Slavs | 98.9 /100 | #76 | Exceptional 46.1% |
| Immigrants | Eastern Asia | 98.9 /100 | #77 | Exceptional 46.2% |
| Immigrants | Western Europe | 98.8 /100 | #78 | Exceptional 46.2% |
| Swiss | 98.8 /100 | #79 | Exceptional 46.2% |
| Soviet Union | 98.8 /100 | #80 | Exceptional 46.2% |
| New Zealanders | 98.8 /100 | #81 | Exceptional 46.2% |
| Immigrants | Latvia | 98.7 /100 | #82 | Exceptional 46.2% |
| Argentineans | 98.7 /100 | #83 | Exceptional 46.2% |
| Immigrants | Jordan | 98.7 /100 | #84 | Exceptional 46.2% |
| Immigrants | Southern Europe | 98.6 /100 | #85 | Exceptional 46.2% |
| Romanians | 98.6 /100 | #86 | Exceptional 46.2% |
| Danes | 98.6 /100 | #87 | Exceptional 46.2% |