West Indian vs Slavic Disability Age 65 to 74
COMPARE
West Indian
Slavic
Disability Age 65 to 74
Disability Age 65 to 74 Comparison
West Indians
Slavs
24.5%
DISABILITY AGE 65 TO 74
3.4/ 100
METRIC RATING
237th/ 347
METRIC RANK
23.0%
DISABILITY AGE 65 TO 74
75.2/ 100
METRIC RATING
153rd/ 347
METRIC RANK
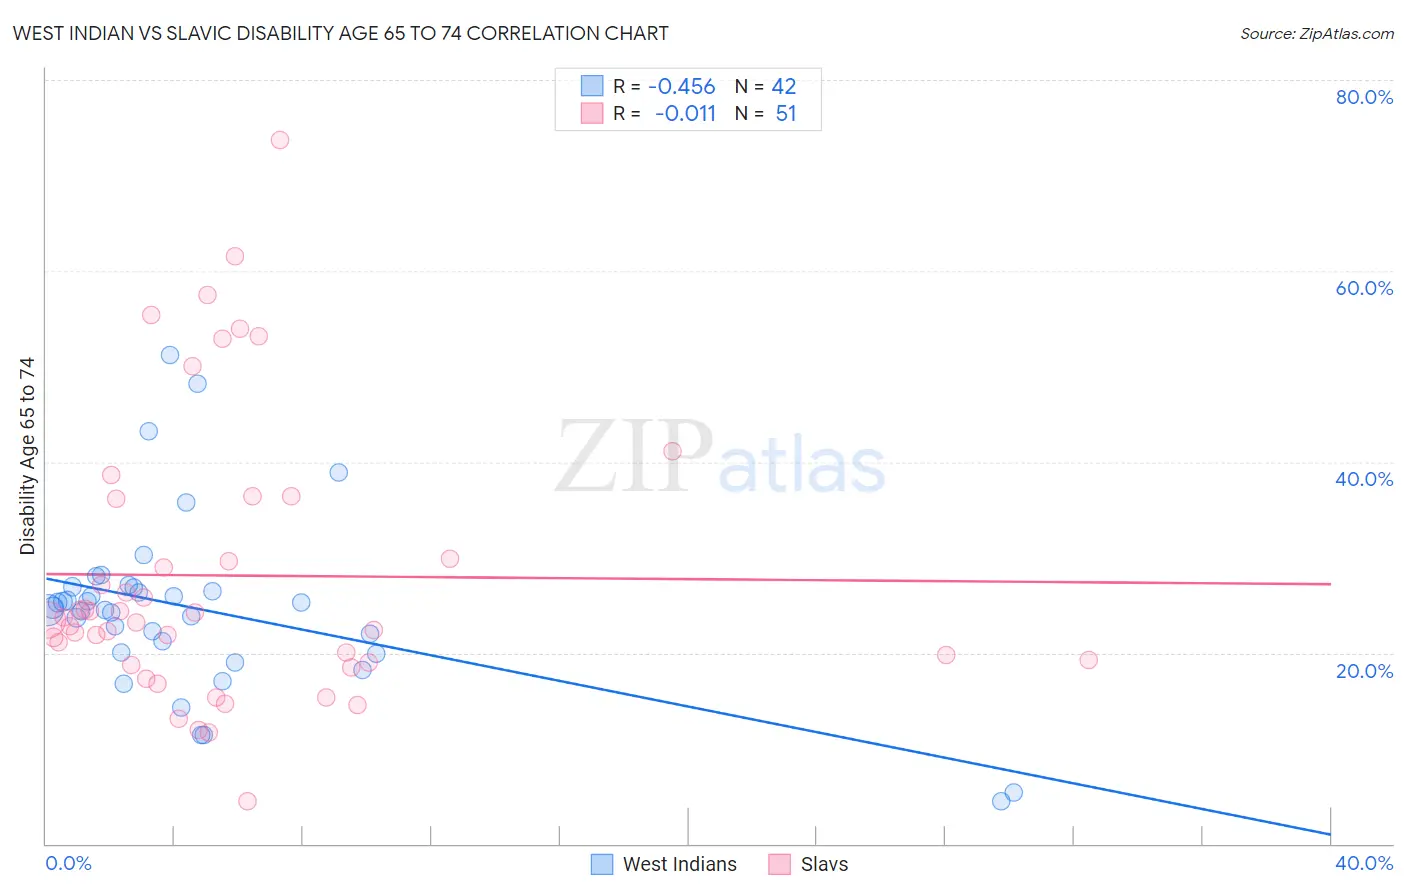
West Indian vs Slavic Disability Age 65 to 74 Correlation Chart
The statistical analysis conducted on geographies consisting of 253,647,264 people shows a moderate negative correlation between the proportion of West Indians and percentage of population with a disability between the ages 65 and 75 in the United States with a correlation coefficient (R) of -0.456 and weighted average of 24.5%. Similarly, the statistical analysis conducted on geographies consisting of 270,690,896 people shows no correlation between the proportion of Slavs and percentage of population with a disability between the ages 65 and 75 in the United States with a correlation coefficient (R) of -0.011 and weighted average of 23.0%, a difference of 6.6%.
Disability Age 65 to 74 Correlation Summary
| Measurement | West Indian | Slavic |
| Minimum | 4.5% | 4.4% |
| Maximum | 51.2% | 73.7% |
| Range | 46.7% | 69.2% |
| Mean | 24.6% | 28.1% |
| Median | 24.6% | 23.4% |
| Interquartile 25% (IQ1) | 20.1% | 19.0% |
| Interquartile 75% (IQ3) | 26.8% | 36.1% |
| Interquartile Range (IQR) | 6.7% | 17.1% |
| Standard Deviation (Sample) | 9.3% | 14.7% |
| Standard Deviation (Population) | 9.1% | 14.6% |
Similar Demographics by Disability Age 65 to 74
Demographics Similar to West Indians by Disability Age 65 to 74
In terms of disability age 65 to 74, the demographic groups most similar to West Indians are German Russian (24.4%, a difference of 0.10%), Scotch-Irish (24.4%, a difference of 0.14%), Immigrants from Ghana (24.5%, a difference of 0.17%), Panamanian (24.4%, a difference of 0.29%), and Immigrants from Caribbean (24.6%, a difference of 0.39%).
| Demographics | Rating | Rank | Disability Age 65 to 74 |
| Barbadians | 6.0 /100 | #230 | Tragic 24.3% |
| Immigrants | Thailand | 5.2 /100 | #231 | Tragic 24.3% |
| Immigrants | Zaire | 5.0 /100 | #232 | Tragic 24.3% |
| Bahamians | 4.5 /100 | #233 | Tragic 24.4% |
| Panamanians | 4.2 /100 | #234 | Tragic 24.4% |
| Scotch-Irish | 3.8 /100 | #235 | Tragic 24.4% |
| German Russians | 3.7 /100 | #236 | Tragic 24.4% |
| West Indians | 3.4 /100 | #237 | Tragic 24.5% |
| Immigrants | Ghana | 3.0 /100 | #238 | Tragic 24.5% |
| Immigrants | Caribbean | 2.6 /100 | #239 | Tragic 24.6% |
| Spaniards | 2.4 /100 | #240 | Tragic 24.6% |
| Immigrants | Western Africa | 2.3 /100 | #241 | Tragic 24.6% |
| Immigrants | Senegal | 2.2 /100 | #242 | Tragic 24.6% |
| Spanish | 2.2 /100 | #243 | Tragic 24.6% |
| Armenians | 2.0 /100 | #244 | Tragic 24.7% |
Demographics Similar to Slavs by Disability Age 65 to 74
In terms of disability age 65 to 74, the demographic groups most similar to Slavs are Sri Lankan (23.0%, a difference of 0.090%), British (23.0%, a difference of 0.10%), Immigrants from Western Asia (23.0%, a difference of 0.10%), Finnish (22.9%, a difference of 0.11%), and Canadian (22.9%, a difference of 0.20%).
| Demographics | Rating | Rank | Disability Age 65 to 74 |
| Alsatians | 83.7 /100 | #146 | Excellent 22.8% |
| Immigrants | Uzbekistan | 83.1 /100 | #147 | Excellent 22.8% |
| New Zealanders | 79.9 /100 | #148 | Good 22.9% |
| Swiss | 79.7 /100 | #149 | Good 22.9% |
| Canadians | 77.7 /100 | #150 | Good 22.9% |
| Immigrants | Morocco | 77.6 /100 | #151 | Good 22.9% |
| Finns | 76.5 /100 | #152 | Good 22.9% |
| Slavs | 75.2 /100 | #153 | Good 23.0% |
| Sri Lankans | 74.0 /100 | #154 | Good 23.0% |
| British | 73.9 /100 | #155 | Good 23.0% |
| Immigrants | Western Asia | 73.8 /100 | #156 | Good 23.0% |
| Czechoslovakians | 72.4 /100 | #157 | Good 23.0% |
| Immigrants | Vietnam | 69.1 /100 | #158 | Good 23.1% |
| South American Indians | 65.5 /100 | #159 | Good 23.1% |
| Koreans | 64.2 /100 | #160 | Good 23.1% |