Immigrants from Ireland vs Latvian Disability Age 65 to 74
COMPARE
Immigrants from Ireland
Latvian
Disability Age 65 to 74
Disability Age 65 to 74 Comparison
Immigrants from Ireland
Latvians
20.3%
DISABILITY AGE 65 TO 74
100.0/ 100
METRIC RATING
11th/ 347
METRIC RANK
21.2%
DISABILITY AGE 65 TO 74
99.8/ 100
METRIC RATING
40th/ 347
METRIC RANK
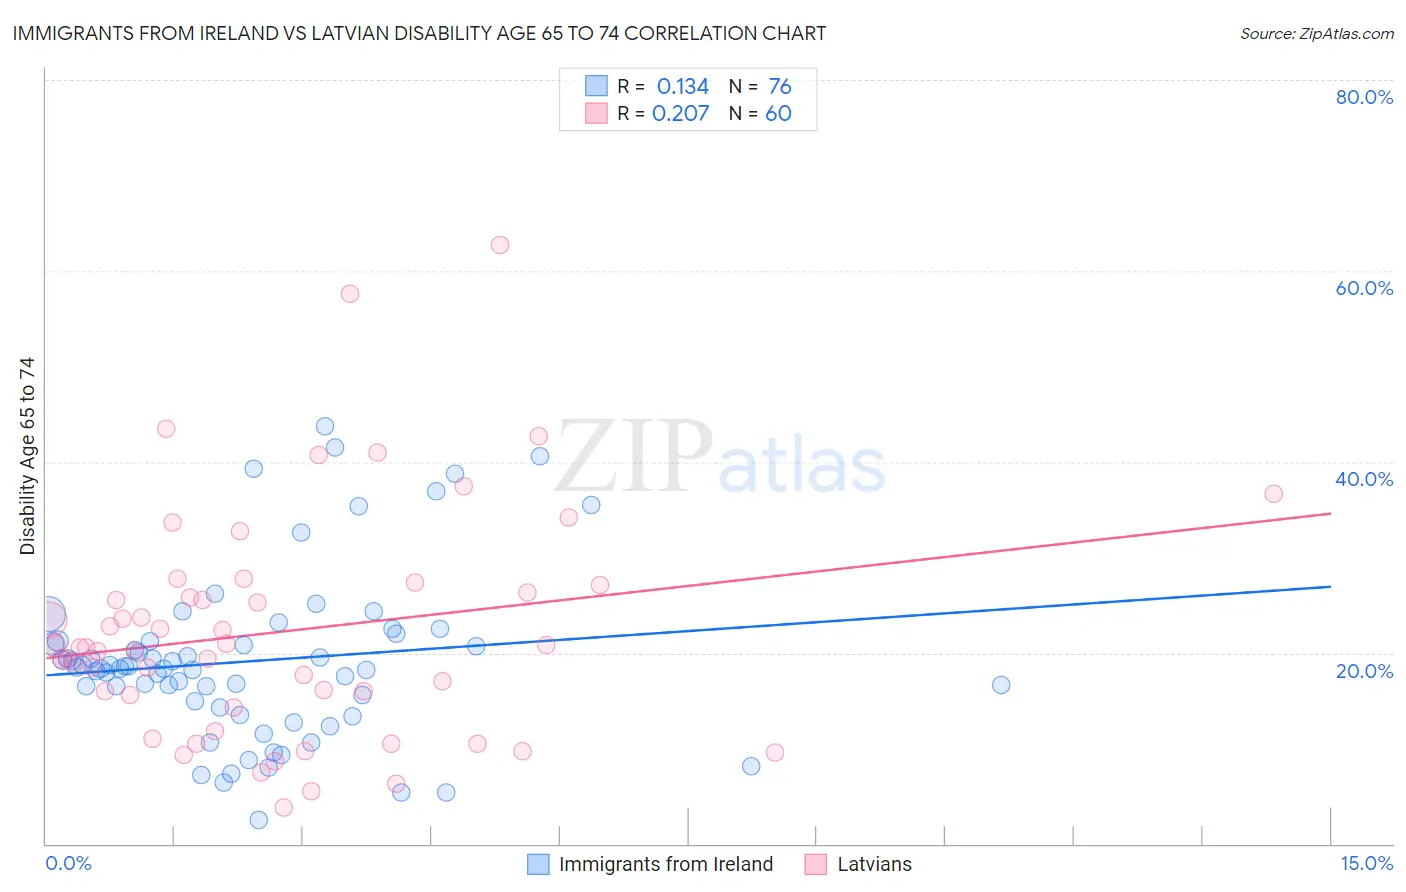
Immigrants from Ireland vs Latvian Disability Age 65 to 74 Correlation Chart
The statistical analysis conducted on geographies consisting of 240,654,975 people shows a poor positive correlation between the proportion of Immigrants from Ireland and percentage of population with a disability between the ages 65 and 75 in the United States with a correlation coefficient (R) of 0.134 and weighted average of 20.3%. Similarly, the statistical analysis conducted on geographies consisting of 220,453,465 people shows a weak positive correlation between the proportion of Latvians and percentage of population with a disability between the ages 65 and 75 in the United States with a correlation coefficient (R) of 0.207 and weighted average of 21.2%, a difference of 4.5%.
Disability Age 65 to 74 Correlation Summary
| Measurement | Immigrants from Ireland | Latvian |
| Minimum | 2.4% | 3.8% |
| Maximum | 43.8% | 62.7% |
| Range | 41.3% | 58.9% |
| Mean | 19.1% | 22.2% |
| Median | 18.4% | 20.6% |
| Interquartile 25% (IQ1) | 14.6% | 14.9% |
| Interquartile 75% (IQ3) | 21.2% | 26.7% |
| Interquartile Range (IQR) | 6.6% | 11.7% |
| Standard Deviation (Sample) | 8.7% | 11.9% |
| Standard Deviation (Population) | 8.7% | 11.8% |
Similar Demographics by Disability Age 65 to 74
Demographics Similar to Immigrants from Ireland by Disability Age 65 to 74
In terms of disability age 65 to 74, the demographic groups most similar to Immigrants from Ireland are Immigrants from Eastern Asia (20.3%, a difference of 0.16%), Immigrants from Korea (20.4%, a difference of 0.21%), Immigrants from China (20.3%, a difference of 0.23%), Immigrants from Singapore (20.4%, a difference of 0.60%), and Indian (Asian) (20.5%, a difference of 1.1%).
| Demographics | Rating | Rank | Disability Age 65 to 74 |
| Immigrants | Hong Kong | 100.0 /100 | #4 | Exceptional 19.9% |
| Immigrants | Israel | 100.0 /100 | #5 | Exceptional 19.9% |
| Iranians | 100.0 /100 | #6 | Exceptional 19.9% |
| Cypriots | 100.0 /100 | #7 | Exceptional 20.1% |
| Thais | 100.0 /100 | #8 | Exceptional 20.1% |
| Immigrants | China | 100.0 /100 | #9 | Exceptional 20.3% |
| Immigrants | Eastern Asia | 100.0 /100 | #10 | Exceptional 20.3% |
| Immigrants | Ireland | 100.0 /100 | #11 | Exceptional 20.3% |
| Immigrants | Korea | 100.0 /100 | #12 | Exceptional 20.4% |
| Immigrants | Singapore | 100.0 /100 | #13 | Exceptional 20.4% |
| Indians (Asian) | 100.0 /100 | #14 | Exceptional 20.5% |
| Paraguayans | 100.0 /100 | #15 | Exceptional 20.5% |
| Immigrants | Lithuania | 100.0 /100 | #16 | Exceptional 20.5% |
| Immigrants | South Central Asia | 100.0 /100 | #17 | Exceptional 20.6% |
| Eastern Europeans | 100.0 /100 | #18 | Exceptional 20.6% |
Demographics Similar to Latvians by Disability Age 65 to 74
In terms of disability age 65 to 74, the demographic groups most similar to Latvians are Immigrants from Austria (21.2%, a difference of 0.060%), Argentinean (21.2%, a difference of 0.16%), Israeli (21.2%, a difference of 0.35%), Russian (21.2%, a difference of 0.35%), and Immigrants from Switzerland (21.1%, a difference of 0.46%).
| Demographics | Rating | Rank | Disability Age 65 to 74 |
| Immigrants | Argentina | 99.9 /100 | #33 | Exceptional 21.1% |
| Immigrants | Sri Lanka | 99.9 /100 | #34 | Exceptional 21.1% |
| Bulgarians | 99.9 /100 | #35 | Exceptional 21.1% |
| Immigrants | Switzerland | 99.8 /100 | #36 | Exceptional 21.1% |
| Israelis | 99.8 /100 | #37 | Exceptional 21.2% |
| Russians | 99.8 /100 | #38 | Exceptional 21.2% |
| Argentineans | 99.8 /100 | #39 | Exceptional 21.2% |
| Latvians | 99.8 /100 | #40 | Exceptional 21.2% |
| Immigrants | Austria | 99.8 /100 | #41 | Exceptional 21.2% |
| Macedonians | 99.7 /100 | #42 | Exceptional 21.3% |
| Immigrants | Croatia | 99.7 /100 | #43 | Exceptional 21.3% |
| Estonians | 99.7 /100 | #44 | Exceptional 21.4% |
| Asians | 99.7 /100 | #45 | Exceptional 21.4% |
| Immigrants | Turkey | 99.7 /100 | #46 | Exceptional 21.4% |
| Immigrants | Bulgaria | 99.7 /100 | #47 | Exceptional 21.4% |