Hawaiian vs Latvian Disability Age 18 to 34
COMPARE
Hawaiian
Latvian
Disability Age 18 to 34
Disability Age 18 to 34 Comparison
Hawaiians
Latvians
6.9%
DISABILITY AGE 18 TO 34
6.5/ 100
METRIC RATING
219th/ 347
METRIC RANK
6.8%
DISABILITY AGE 18 TO 34
11.1/ 100
METRIC RATING
210th/ 347
METRIC RANK
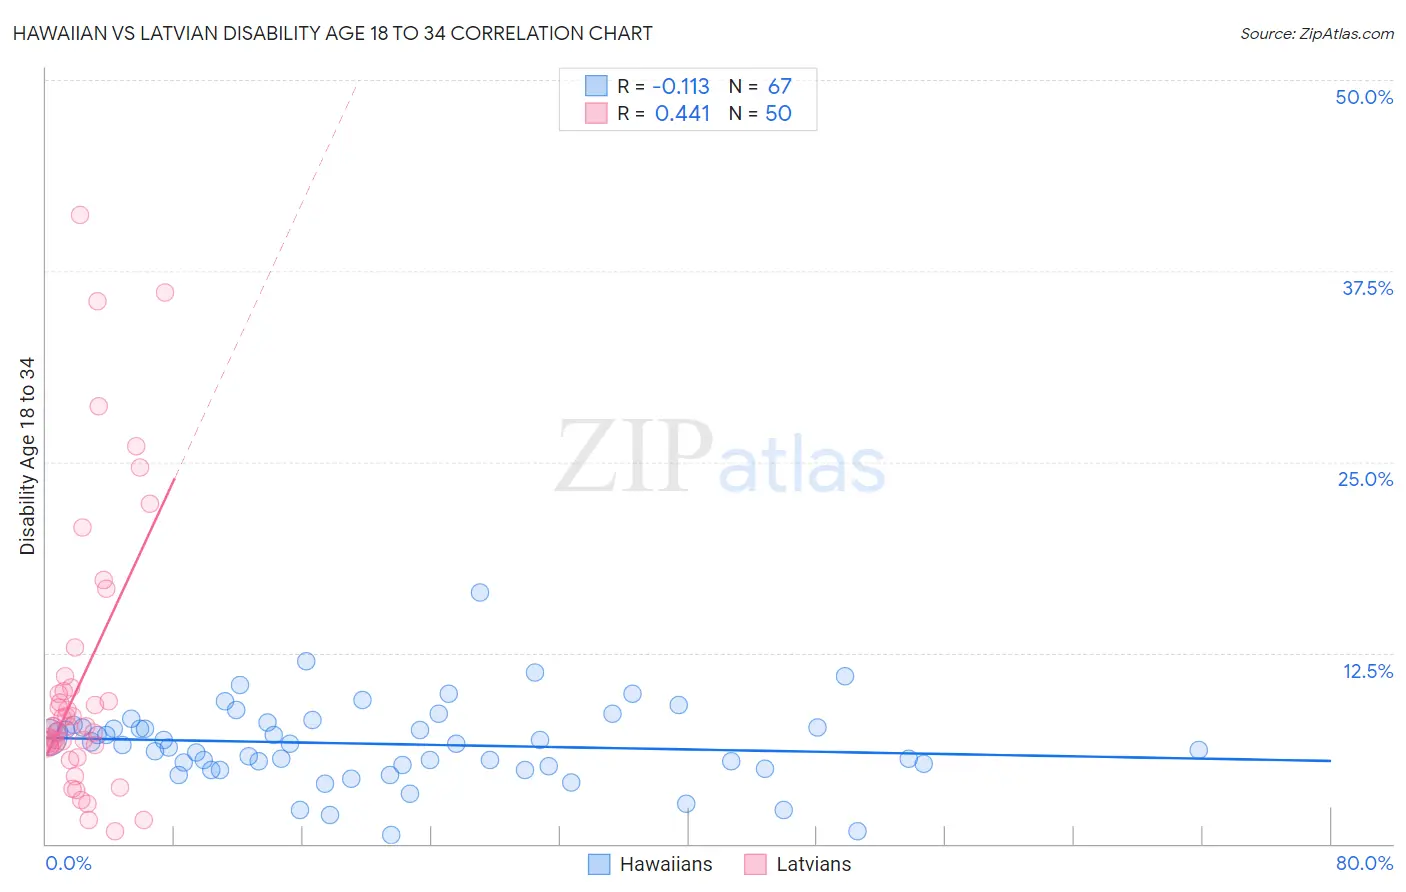
Hawaiian vs Latvian Disability Age 18 to 34 Correlation Chart
The statistical analysis conducted on geographies consisting of 326,941,829 people shows a poor negative correlation between the proportion of Hawaiians and percentage of population with a disability between the ages 18 and 35 in the United States with a correlation coefficient (R) of -0.113 and weighted average of 6.9%. Similarly, the statistical analysis conducted on geographies consisting of 220,392,708 people shows a moderate positive correlation between the proportion of Latvians and percentage of population with a disability between the ages 18 and 35 in the United States with a correlation coefficient (R) of 0.441 and weighted average of 6.8%, a difference of 0.98%.
Disability Age 18 to 34 Correlation Summary
| Measurement | Hawaiian | Latvian |
| Minimum | 0.54% | 0.83% |
| Maximum | 16.4% | 41.2% |
| Range | 15.9% | 40.3% |
| Mean | 6.5% | 10.8% |
| Median | 6.5% | 7.7% |
| Interquartile 25% (IQ1) | 5.1% | 6.4% |
| Interquartile 75% (IQ3) | 7.8% | 10.2% |
| Interquartile Range (IQR) | 2.8% | 3.8% |
| Standard Deviation (Sample) | 2.7% | 9.2% |
| Standard Deviation (Population) | 2.6% | 9.1% |
Demographics Similar to Hawaiians and Latvians by Disability Age 18 to 34
In terms of disability age 18 to 34, the demographic groups most similar to Hawaiians are Ukrainian (6.9%, a difference of 0.060%), Immigrants from Kenya (6.9%, a difference of 0.12%), Sudanese (6.9%, a difference of 0.14%), Immigrants from Thailand (6.9%, a difference of 0.27%), and Immigrants from Senegal (6.9%, a difference of 0.29%). Similarly, the demographic groups most similar to Latvians are Immigrants from Burma/Myanmar (6.8%, a difference of 0.20%), Immigrants from Norway (6.8%, a difference of 0.20%), Immigrants from Scotland (6.8%, a difference of 0.22%), Mexican (6.8%, a difference of 0.24%), and Japanese (6.8%, a difference of 0.27%).
| Demographics | Rating | Rank | Disability Age 18 to 34 |
| Immigrants | Bosnia and Herzegovina | 13.6 /100 | #204 | Poor 6.8% |
| Lebanese | 13.3 /100 | #205 | Poor 6.8% |
| Japanese | 12.8 /100 | #206 | Poor 6.8% |
| Mexicans | 12.6 /100 | #207 | Poor 6.8% |
| Immigrants | Scotland | 12.4 /100 | #208 | Poor 6.8% |
| Immigrants | Burma/Myanmar | 12.3 /100 | #209 | Poor 6.8% |
| Latvians | 11.1 /100 | #210 | Poor 6.8% |
| Immigrants | Norway | 10.0 /100 | #211 | Tragic 6.8% |
| Luxembourgers | 9.4 /100 | #212 | Tragic 6.9% |
| Immigrants | Western Europe | 9.1 /100 | #213 | Tragic 6.9% |
| Serbians | 8.2 /100 | #214 | Tragic 6.9% |
| Immigrants | Thailand | 7.5 /100 | #215 | Tragic 6.9% |
| Sudanese | 7.0 /100 | #216 | Tragic 6.9% |
| Immigrants | Kenya | 6.9 /100 | #217 | Tragic 6.9% |
| Ukrainians | 6.7 /100 | #218 | Tragic 6.9% |
| Hawaiians | 6.5 /100 | #219 | Tragic 6.9% |
| Immigrants | Senegal | 5.5 /100 | #220 | Tragic 6.9% |
| Immigrants | Middle Africa | 5.5 /100 | #221 | Tragic 6.9% |
| Immigrants | England | 5.3 /100 | #222 | Tragic 6.9% |
| Carpatho Rusyns | 5.2 /100 | #223 | Tragic 6.9% |
| Senegalese | 4.9 /100 | #224 | Tragic 6.9% |