Black/African American vs Ukrainian Cognitive Disability
COMPARE
Black/African American
Ukrainian
Cognitive Disability
Cognitive Disability Comparison
Blacks/African Americans
Ukrainians
19.0%
COGNITIVE DISABILITY
0.0/ 100
METRIC RATING
336th/ 347
METRIC RANK
16.6%
COGNITIVE DISABILITY
99.4/ 100
METRIC RATING
68th/ 347
METRIC RANK
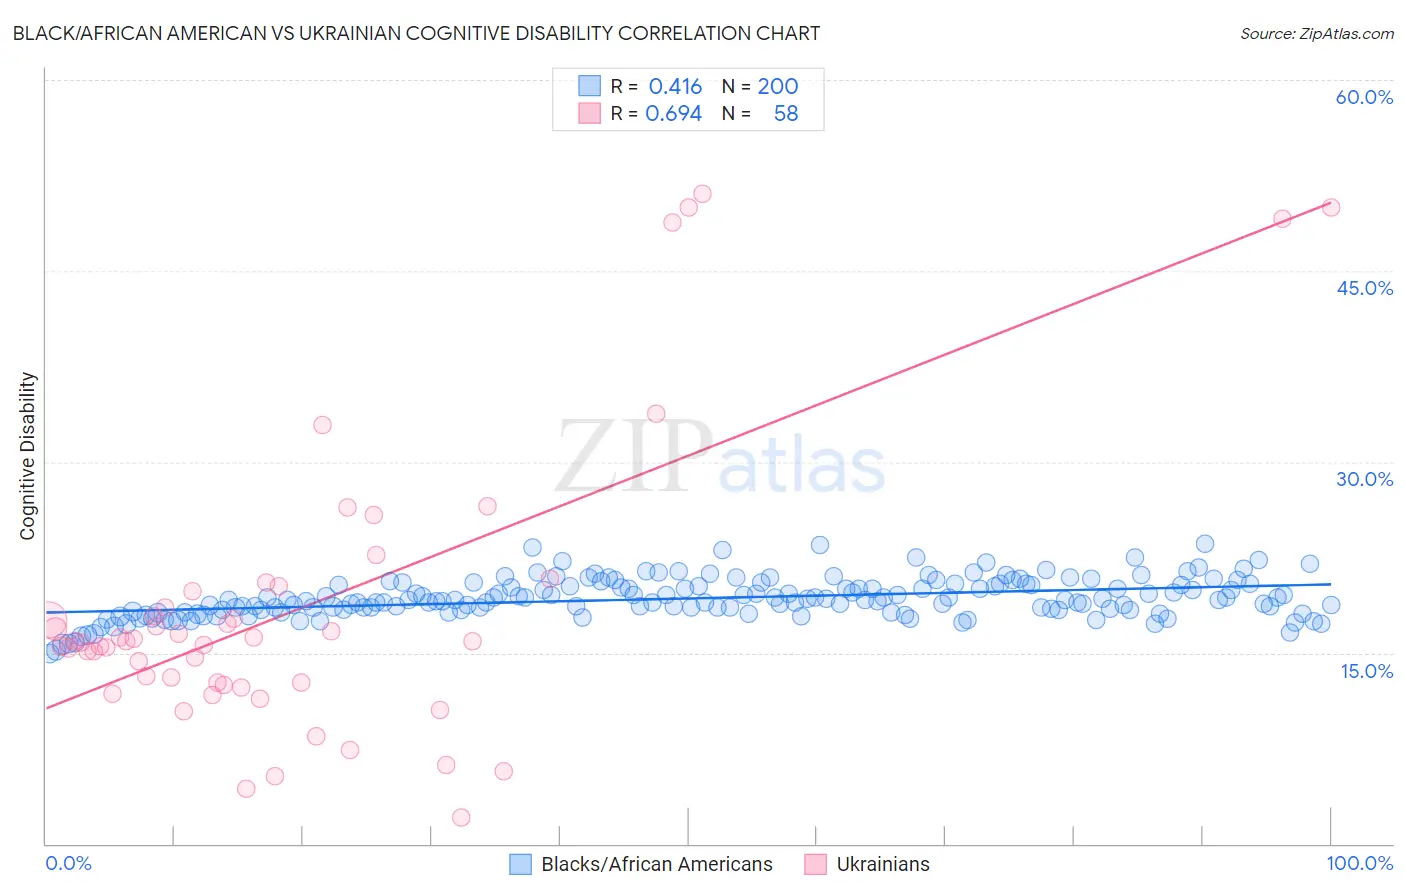
Black/African American vs Ukrainian Cognitive Disability Correlation Chart
The statistical analysis conducted on geographies consisting of 565,879,881 people shows a moderate positive correlation between the proportion of Blacks/African Americans and percentage of population with cognitive disability in the United States with a correlation coefficient (R) of 0.416 and weighted average of 19.0%. Similarly, the statistical analysis conducted on geographies consisting of 448,632,729 people shows a significant positive correlation between the proportion of Ukrainians and percentage of population with cognitive disability in the United States with a correlation coefficient (R) of 0.694 and weighted average of 16.6%, a difference of 14.3%.
Cognitive Disability Correlation Summary
| Measurement | Black/African American | Ukrainian |
| Minimum | 15.0% | 2.1% |
| Maximum | 23.5% | 51.1% |
| Range | 8.6% | 49.0% |
| Mean | 19.3% | 18.5% |
| Median | 19.1% | 15.9% |
| Interquartile 25% (IQ1) | 18.3% | 12.6% |
| Interquartile 75% (IQ3) | 20.3% | 19.9% |
| Interquartile Range (IQR) | 2.0% | 7.2% |
| Standard Deviation (Sample) | 1.5% | 11.4% |
| Standard Deviation (Population) | 1.5% | 11.3% |
Similar Demographics by Cognitive Disability
Demographics Similar to Blacks/African Americans by Cognitive Disability
In terms of cognitive disability, the demographic groups most similar to Blacks/African Americans are Immigrants from Saudi Arabia (19.1%, a difference of 0.13%), Senegalese (19.0%, a difference of 0.29%), Lumbee (19.1%, a difference of 0.47%), Sudanese (18.9%, a difference of 0.84%), and Puerto Rican (19.2%, a difference of 0.95%).
| Demographics | Rating | Rank | Cognitive Disability |
| Navajo | 0.0 /100 | #329 | Tragic 18.8% |
| Immigrants | Dominican Republic | 0.0 /100 | #330 | Tragic 18.8% |
| Pima | 0.0 /100 | #331 | Tragic 18.8% |
| Immigrants | Sudan | 0.0 /100 | #332 | Tragic 18.8% |
| Immigrants | Yemen | 0.0 /100 | #333 | Tragic 18.8% |
| Sudanese | 0.0 /100 | #334 | Tragic 18.9% |
| Senegalese | 0.0 /100 | #335 | Tragic 19.0% |
| Blacks/African Americans | 0.0 /100 | #336 | Tragic 19.0% |
| Immigrants | Saudi Arabia | 0.0 /100 | #337 | Tragic 19.1% |
| Lumbee | 0.0 /100 | #338 | Tragic 19.1% |
| Puerto Ricans | 0.0 /100 | #339 | Tragic 19.2% |
| Cape Verdeans | 0.0 /100 | #340 | Tragic 19.2% |
| Tohono O'odham | 0.0 /100 | #341 | Tragic 19.3% |
| Houma | 0.0 /100 | #342 | Tragic 19.3% |
| Immigrants | Zaire | 0.0 /100 | #343 | Tragic 19.4% |
Demographics Similar to Ukrainians by Cognitive Disability
In terms of cognitive disability, the demographic groups most similar to Ukrainians are Latvian (16.6%, a difference of 0.040%), Immigrants from Ukraine (16.6%, a difference of 0.080%), Immigrants from Uzbekistan (16.7%, a difference of 0.080%), Immigrants from Sweden (16.7%, a difference of 0.090%), and Immigrants from Belgium (16.7%, a difference of 0.10%).
| Demographics | Rating | Rank | Cognitive Disability |
| Immigrants | England | 99.6 /100 | #61 | Exceptional 16.6% |
| Czechoslovakians | 99.6 /100 | #62 | Exceptional 16.6% |
| Argentineans | 99.6 /100 | #63 | Exceptional 16.6% |
| Venezuelans | 99.6 /100 | #64 | Exceptional 16.6% |
| Colombians | 99.6 /100 | #65 | Exceptional 16.6% |
| Immigrants | Ukraine | 99.5 /100 | #66 | Exceptional 16.6% |
| Latvians | 99.5 /100 | #67 | Exceptional 16.6% |
| Ukrainians | 99.4 /100 | #68 | Exceptional 16.6% |
| Immigrants | Uzbekistan | 99.4 /100 | #69 | Exceptional 16.7% |
| Immigrants | Sweden | 99.4 /100 | #70 | Exceptional 16.7% |
| Immigrants | Belgium | 99.3 /100 | #71 | Exceptional 16.7% |
| Germans | 99.3 /100 | #72 | Exceptional 16.7% |
| Burmese | 99.3 /100 | #73 | Exceptional 16.7% |
| Slavs | 99.3 /100 | #74 | Exceptional 16.7% |
| Estonians | 99.3 /100 | #75 | Exceptional 16.7% |