Black/African American vs Czech Cognitive Disability
COMPARE
Black/African American
Czech
Cognitive Disability
Cognitive Disability Comparison
Blacks/African Americans
Czechs
19.0%
COGNITIVE DISABILITY
0.0/ 100
METRIC RATING
336th/ 347
METRIC RANK
16.4%
COGNITIVE DISABILITY
99.9/ 100
METRIC RATING
30th/ 347
METRIC RANK
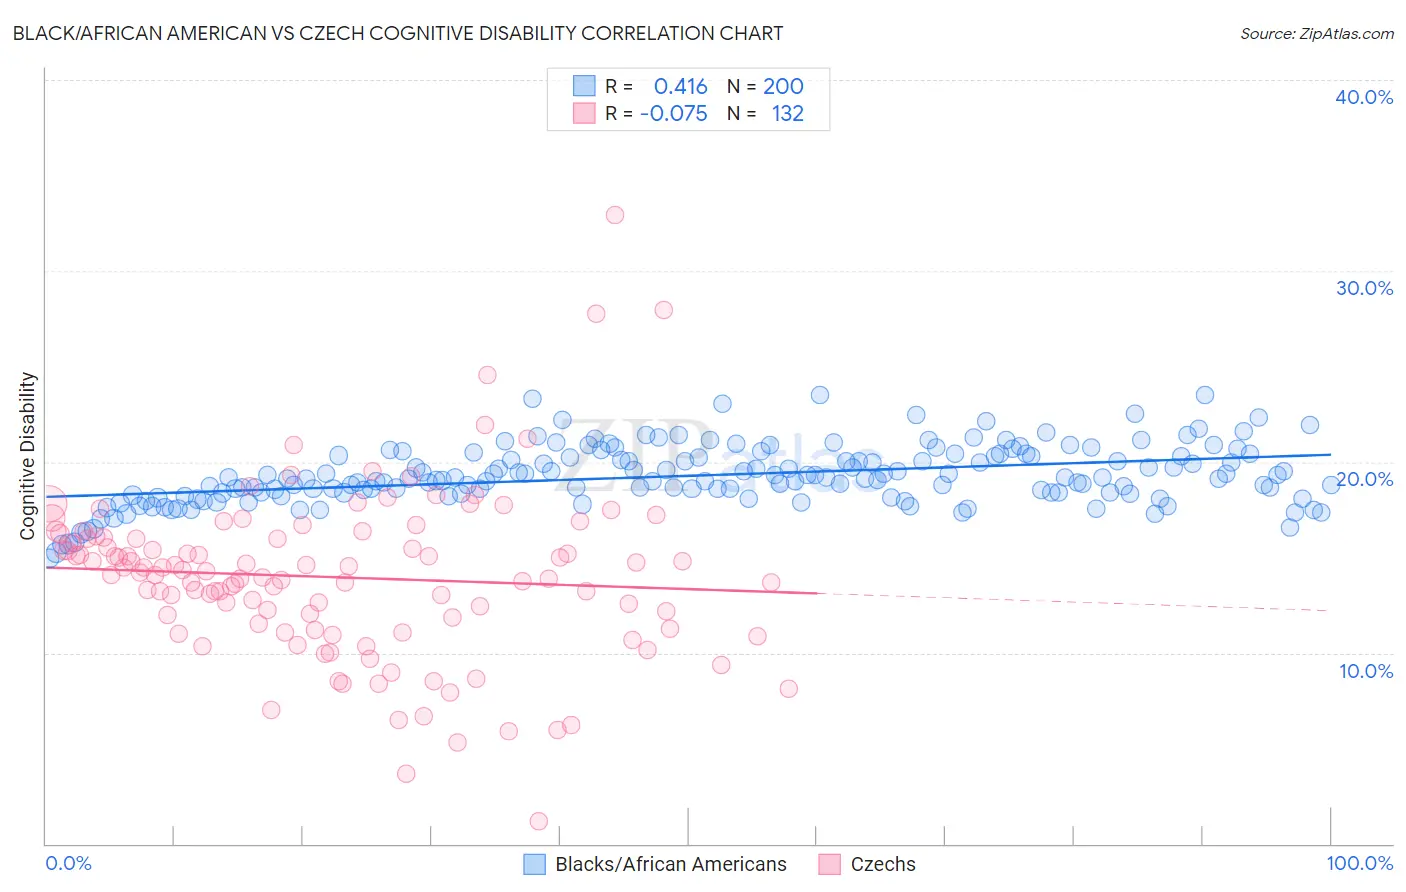
Black/African American vs Czech Cognitive Disability Correlation Chart
The statistical analysis conducted on geographies consisting of 565,879,881 people shows a moderate positive correlation between the proportion of Blacks/African Americans and percentage of population with cognitive disability in the United States with a correlation coefficient (R) of 0.416 and weighted average of 19.0%. Similarly, the statistical analysis conducted on geographies consisting of 484,743,035 people shows a slight negative correlation between the proportion of Czechs and percentage of population with cognitive disability in the United States with a correlation coefficient (R) of -0.075 and weighted average of 16.4%, a difference of 16.1%.
Cognitive Disability Correlation Summary
| Measurement | Black/African American | Czech |
| Minimum | 15.0% | 1.2% |
| Maximum | 23.5% | 32.9% |
| Range | 8.6% | 31.7% |
| Mean | 19.3% | 14.0% |
| Median | 19.1% | 14.1% |
| Interquartile 25% (IQ1) | 18.3% | 11.4% |
| Interquartile 75% (IQ3) | 20.3% | 16.0% |
| Interquartile Range (IQR) | 2.0% | 4.6% |
| Standard Deviation (Sample) | 1.5% | 4.4% |
| Standard Deviation (Population) | 1.5% | 4.4% |
Similar Demographics by Cognitive Disability
Demographics Similar to Blacks/African Americans by Cognitive Disability
In terms of cognitive disability, the demographic groups most similar to Blacks/African Americans are Immigrants from Saudi Arabia (19.1%, a difference of 0.13%), Senegalese (19.0%, a difference of 0.29%), Lumbee (19.1%, a difference of 0.47%), Sudanese (18.9%, a difference of 0.84%), and Puerto Rican (19.2%, a difference of 0.95%).
| Demographics | Rating | Rank | Cognitive Disability |
| Navajo | 0.0 /100 | #329 | Tragic 18.8% |
| Immigrants | Dominican Republic | 0.0 /100 | #330 | Tragic 18.8% |
| Pima | 0.0 /100 | #331 | Tragic 18.8% |
| Immigrants | Sudan | 0.0 /100 | #332 | Tragic 18.8% |
| Immigrants | Yemen | 0.0 /100 | #333 | Tragic 18.8% |
| Sudanese | 0.0 /100 | #334 | Tragic 18.9% |
| Senegalese | 0.0 /100 | #335 | Tragic 19.0% |
| Blacks/African Americans | 0.0 /100 | #336 | Tragic 19.0% |
| Immigrants | Saudi Arabia | 0.0 /100 | #337 | Tragic 19.1% |
| Lumbee | 0.0 /100 | #338 | Tragic 19.1% |
| Puerto Ricans | 0.0 /100 | #339 | Tragic 19.2% |
| Cape Verdeans | 0.0 /100 | #340 | Tragic 19.2% |
| Tohono O'odham | 0.0 /100 | #341 | Tragic 19.3% |
| Houma | 0.0 /100 | #342 | Tragic 19.3% |
| Immigrants | Zaire | 0.0 /100 | #343 | Tragic 19.4% |
Demographics Similar to Czechs by Cognitive Disability
In terms of cognitive disability, the demographic groups most similar to Czechs are Filipino (16.4%, a difference of 0.0%), Immigrants from Romania (16.4%, a difference of 0.020%), Immigrants from Pakistan (16.4%, a difference of 0.030%), Polish (16.4%, a difference of 0.030%), and Immigrants from Croatia (16.4%, a difference of 0.050%).
| Demographics | Rating | Rank | Cognitive Disability |
| Croatians | 99.9 /100 | #23 | Exceptional 16.4% |
| Immigrants | Argentina | 99.9 /100 | #24 | Exceptional 16.4% |
| Luxembourgers | 99.9 /100 | #25 | Exceptional 16.4% |
| Immigrants | Croatia | 99.9 /100 | #26 | Exceptional 16.4% |
| Immigrants | Pakistan | 99.9 /100 | #27 | Exceptional 16.4% |
| Poles | 99.9 /100 | #28 | Exceptional 16.4% |
| Filipinos | 99.9 /100 | #29 | Exceptional 16.4% |
| Czechs | 99.9 /100 | #30 | Exceptional 16.4% |
| Immigrants | Romania | 99.9 /100 | #31 | Exceptional 16.4% |
| Immigrants | Israel | 99.9 /100 | #32 | Exceptional 16.4% |
| Italians | 99.9 /100 | #33 | Exceptional 16.4% |
| Russians | 99.9 /100 | #34 | Exceptional 16.4% |
| Slovaks | 99.9 /100 | #35 | Exceptional 16.4% |
| Greeks | 99.9 /100 | #36 | Exceptional 16.4% |
| Slovenes | 99.9 /100 | #37 | Exceptional 16.5% |