Black/African American vs Immigrants from Portugal Cognitive Disability
COMPARE
Black/African American
Immigrants from Portugal
Cognitive Disability
Cognitive Disability Comparison
Blacks/African Americans
Immigrants from Portugal
19.0%
COGNITIVE DISABILITY
0.0/ 100
METRIC RATING
336th/ 347
METRIC RANK
17.2%
COGNITIVE DISABILITY
61.8/ 100
METRIC RATING
169th/ 347
METRIC RANK
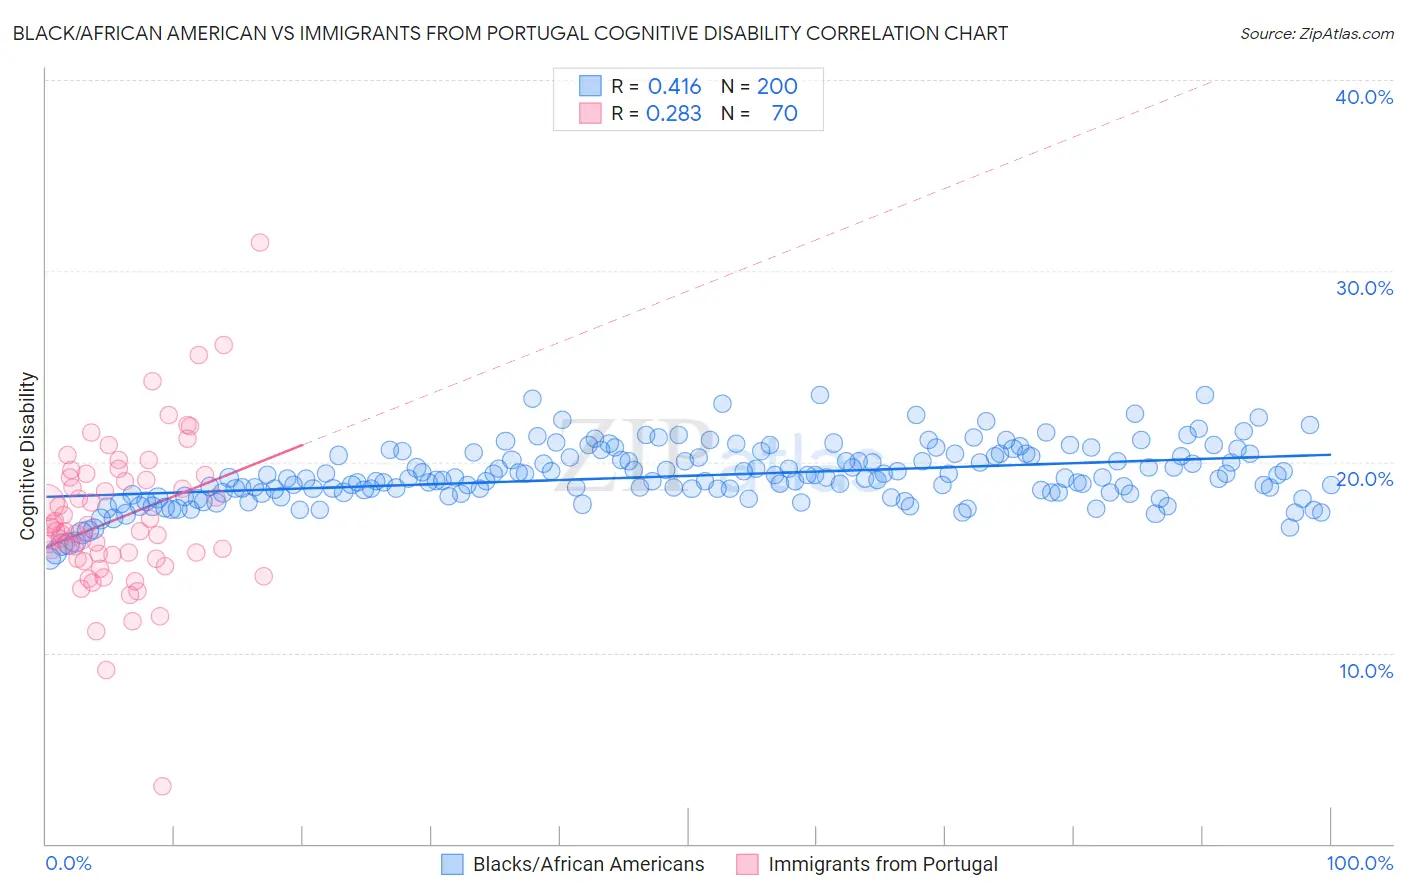
Black/African American vs Immigrants from Portugal Cognitive Disability Correlation Chart
The statistical analysis conducted on geographies consisting of 565,879,881 people shows a moderate positive correlation between the proportion of Blacks/African Americans and percentage of population with cognitive disability in the United States with a correlation coefficient (R) of 0.416 and weighted average of 19.0%. Similarly, the statistical analysis conducted on geographies consisting of 174,785,813 people shows a weak positive correlation between the proportion of Immigrants from Portugal and percentage of population with cognitive disability in the United States with a correlation coefficient (R) of 0.283 and weighted average of 17.2%, a difference of 10.5%.
Cognitive Disability Correlation Summary
| Measurement | Black/African American | Immigrants from Portugal |
| Minimum | 15.0% | 3.0% |
| Maximum | 23.5% | 31.5% |
| Range | 8.6% | 28.5% |
| Mean | 19.3% | 17.0% |
| Median | 19.1% | 16.4% |
| Interquartile 25% (IQ1) | 18.3% | 15.0% |
| Interquartile 75% (IQ3) | 20.3% | 19.2% |
| Interquartile Range (IQR) | 2.0% | 4.3% |
| Standard Deviation (Sample) | 1.5% | 4.0% |
| Standard Deviation (Population) | 1.5% | 4.0% |
Similar Demographics by Cognitive Disability
Demographics Similar to Blacks/African Americans by Cognitive Disability
In terms of cognitive disability, the demographic groups most similar to Blacks/African Americans are Immigrants from Saudi Arabia (19.1%, a difference of 0.13%), Senegalese (19.0%, a difference of 0.29%), Lumbee (19.1%, a difference of 0.47%), Sudanese (18.9%, a difference of 0.84%), and Puerto Rican (19.2%, a difference of 0.95%).
| Demographics | Rating | Rank | Cognitive Disability |
| Navajo | 0.0 /100 | #329 | Tragic 18.8% |
| Immigrants | Dominican Republic | 0.0 /100 | #330 | Tragic 18.8% |
| Pima | 0.0 /100 | #331 | Tragic 18.8% |
| Immigrants | Sudan | 0.0 /100 | #332 | Tragic 18.8% |
| Immigrants | Yemen | 0.0 /100 | #333 | Tragic 18.8% |
| Sudanese | 0.0 /100 | #334 | Tragic 18.9% |
| Senegalese | 0.0 /100 | #335 | Tragic 19.0% |
| Blacks/African Americans | 0.0 /100 | #336 | Tragic 19.0% |
| Immigrants | Saudi Arabia | 0.0 /100 | #337 | Tragic 19.1% |
| Lumbee | 0.0 /100 | #338 | Tragic 19.1% |
| Puerto Ricans | 0.0 /100 | #339 | Tragic 19.2% |
| Cape Verdeans | 0.0 /100 | #340 | Tragic 19.2% |
| Tohono O'odham | 0.0 /100 | #341 | Tragic 19.3% |
| Houma | 0.0 /100 | #342 | Tragic 19.3% |
| Immigrants | Zaire | 0.0 /100 | #343 | Tragic 19.4% |
Demographics Similar to Immigrants from Portugal by Cognitive Disability
In terms of cognitive disability, the demographic groups most similar to Immigrants from Portugal are Immigrants (17.2%, a difference of 0.020%), Immigrants from Syria (17.2%, a difference of 0.050%), Ecuadorian (17.2%, a difference of 0.070%), Tlingit-Haida (17.2%, a difference of 0.070%), and Immigrants from Ecuador (17.2%, a difference of 0.080%).
| Demographics | Rating | Rank | Cognitive Disability |
| Yugoslavians | 71.6 /100 | #162 | Good 17.2% |
| Immigrants | Switzerland | 71.5 /100 | #163 | Good 17.2% |
| Armenians | 70.1 /100 | #164 | Good 17.2% |
| Immigrants | Albania | 64.9 /100 | #165 | Good 17.2% |
| Immigrants | Ecuador | 64.4 /100 | #166 | Good 17.2% |
| Immigrants | Syria | 63.5 /100 | #167 | Good 17.2% |
| Immigrants | Immigrants | 62.5 /100 | #168 | Good 17.2% |
| Immigrants | Portugal | 61.8 /100 | #169 | Good 17.2% |
| Ecuadorians | 59.6 /100 | #170 | Average 17.2% |
| Tlingit-Haida | 59.4 /100 | #171 | Average 17.2% |
| Immigrants | Turkey | 56.7 /100 | #172 | Average 17.2% |
| Immigrants | Northern Africa | 50.2 /100 | #173 | Average 17.3% |
| Laotians | 50.0 /100 | #174 | Average 17.3% |
| Tsimshian | 49.8 /100 | #175 | Average 17.3% |
| Shoshone | 49.2 /100 | #176 | Average 17.3% |