Immigrants from Ireland vs Iranian Cognitive Disability
COMPARE
Immigrants from Ireland
Iranian
Cognitive Disability
Cognitive Disability Comparison
Immigrants from Ireland
Iranians
16.1%
COGNITIVE DISABILITY
100.0/ 100
METRIC RATING
7th/ 347
METRIC RANK
16.5%
COGNITIVE DISABILITY
99.8/ 100
METRIC RATING
49th/ 347
METRIC RANK
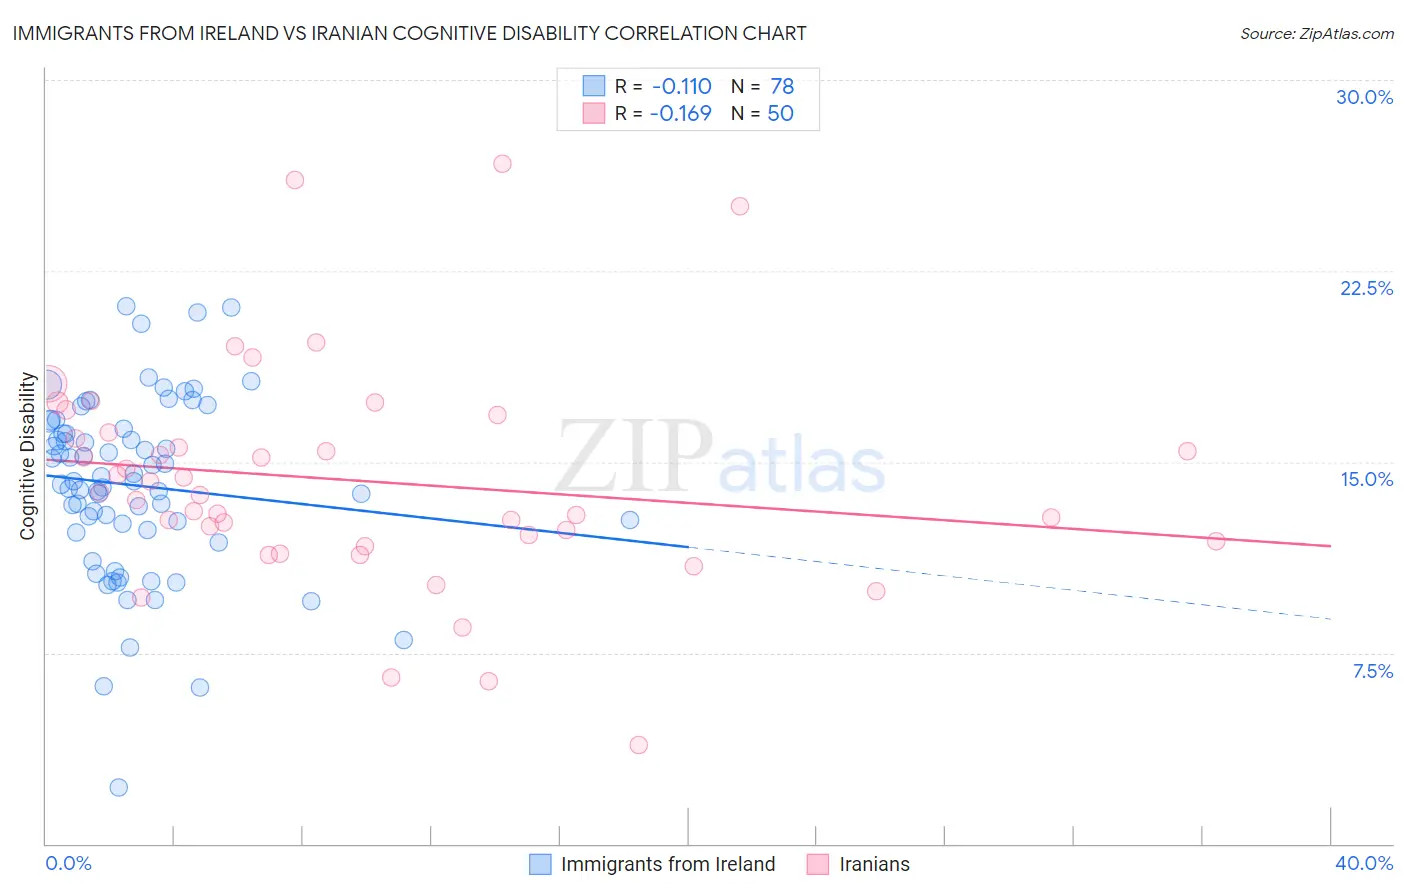
Immigrants from Ireland vs Iranian Cognitive Disability Correlation Chart
The statistical analysis conducted on geographies consisting of 240,767,768 people shows a poor negative correlation between the proportion of Immigrants from Ireland and percentage of population with cognitive disability in the United States with a correlation coefficient (R) of -0.110 and weighted average of 16.1%. Similarly, the statistical analysis conducted on geographies consisting of 316,831,164 people shows a poor negative correlation between the proportion of Iranians and percentage of population with cognitive disability in the United States with a correlation coefficient (R) of -0.169 and weighted average of 16.5%, a difference of 2.3%.
Cognitive Disability Correlation Summary
| Measurement | Immigrants from Ireland | Iranian |
| Minimum | 2.2% | 3.9% |
| Maximum | 21.1% | 26.7% |
| Range | 18.9% | 22.8% |
| Mean | 14.1% | 14.3% |
| Median | 14.2% | 13.7% |
| Interquartile 25% (IQ1) | 12.3% | 11.9% |
| Interquartile 75% (IQ3) | 16.3% | 16.2% |
| Interquartile Range (IQR) | 4.0% | 4.3% |
| Standard Deviation (Sample) | 3.5% | 4.4% |
| Standard Deviation (Population) | 3.5% | 4.4% |
Similar Demographics by Cognitive Disability
Demographics Similar to Immigrants from Ireland by Cognitive Disability
In terms of cognitive disability, the demographic groups most similar to Immigrants from Ireland are Immigrants from Poland (16.1%, a difference of 0.020%), Thai (16.1%, a difference of 0.11%), Assyrian/Chaldean/Syriac (16.2%, a difference of 0.34%), Immigrants from Scotland (16.2%, a difference of 0.38%), and Immigrants from Czechoslovakia (16.2%, a difference of 0.47%).
| Demographics | Rating | Rank | Cognitive Disability |
| Immigrants | Taiwan | 100.0 /100 | #1 | Exceptional 15.7% |
| Immigrants | India | 100.0 /100 | #2 | Exceptional 15.9% |
| Chinese | 100.0 /100 | #3 | Exceptional 15.9% |
| Immigrants | Lithuania | 100.0 /100 | #4 | Exceptional 16.0% |
| Immigrants | Hong Kong | 100.0 /100 | #5 | Exceptional 16.0% |
| Thais | 100.0 /100 | #6 | Exceptional 16.1% |
| Immigrants | Ireland | 100.0 /100 | #7 | Exceptional 16.1% |
| Immigrants | Poland | 100.0 /100 | #8 | Exceptional 16.1% |
| Assyrians/Chaldeans/Syriacs | 100.0 /100 | #9 | Exceptional 16.2% |
| Immigrants | Scotland | 100.0 /100 | #10 | Exceptional 16.2% |
| Immigrants | Czechoslovakia | 100.0 /100 | #11 | Exceptional 16.2% |
| Maltese | 100.0 /100 | #12 | Exceptional 16.2% |
| Lithuanians | 100.0 /100 | #13 | Exceptional 16.3% |
| Immigrants | Austria | 100.0 /100 | #14 | Exceptional 16.3% |
| Immigrants | Greece | 100.0 /100 | #15 | Exceptional 16.3% |
Demographics Similar to Iranians by Cognitive Disability
In terms of cognitive disability, the demographic groups most similar to Iranians are Norwegian (16.5%, a difference of 0.010%), Immigrants from Italy (16.5%, a difference of 0.040%), Immigrants from North America (16.5%, a difference of 0.040%), Immigrants from Korea (16.5%, a difference of 0.050%), and Immigrants from Colombia (16.5%, a difference of 0.070%).
| Demographics | Rating | Rank | Cognitive Disability |
| Hungarians | 99.9 /100 | #42 | Exceptional 16.5% |
| Immigrants | Canada | 99.8 /100 | #43 | Exceptional 16.5% |
| Macedonians | 99.8 /100 | #44 | Exceptional 16.5% |
| Immigrants | Europe | 99.8 /100 | #45 | Exceptional 16.5% |
| Immigrants | Colombia | 99.8 /100 | #46 | Exceptional 16.5% |
| Immigrants | Italy | 99.8 /100 | #47 | Exceptional 16.5% |
| Immigrants | North America | 99.8 /100 | #48 | Exceptional 16.5% |
| Iranians | 99.8 /100 | #49 | Exceptional 16.5% |
| Norwegians | 99.8 /100 | #50 | Exceptional 16.5% |
| Immigrants | Korea | 99.8 /100 | #51 | Exceptional 16.5% |
| Soviet Union | 99.8 /100 | #52 | Exceptional 16.5% |
| Swedes | 99.8 /100 | #53 | Exceptional 16.5% |
| Immigrants | Iran | 99.8 /100 | #54 | Exceptional 16.5% |
| Immigrants | Venezuela | 99.7 /100 | #55 | Exceptional 16.5% |
| Austrians | 99.7 /100 | #56 | Exceptional 16.6% |