Black/African American vs Bahamian Cognitive Disability
COMPARE
Black/African American
Bahamian
Cognitive Disability
Cognitive Disability Comparison
Blacks/African Americans
Bahamians
19.0%
COGNITIVE DISABILITY
0.0/ 100
METRIC RATING
336th/ 347
METRIC RANK
17.9%
COGNITIVE DISABILITY
0.6/ 100
METRIC RATING
256th/ 347
METRIC RANK
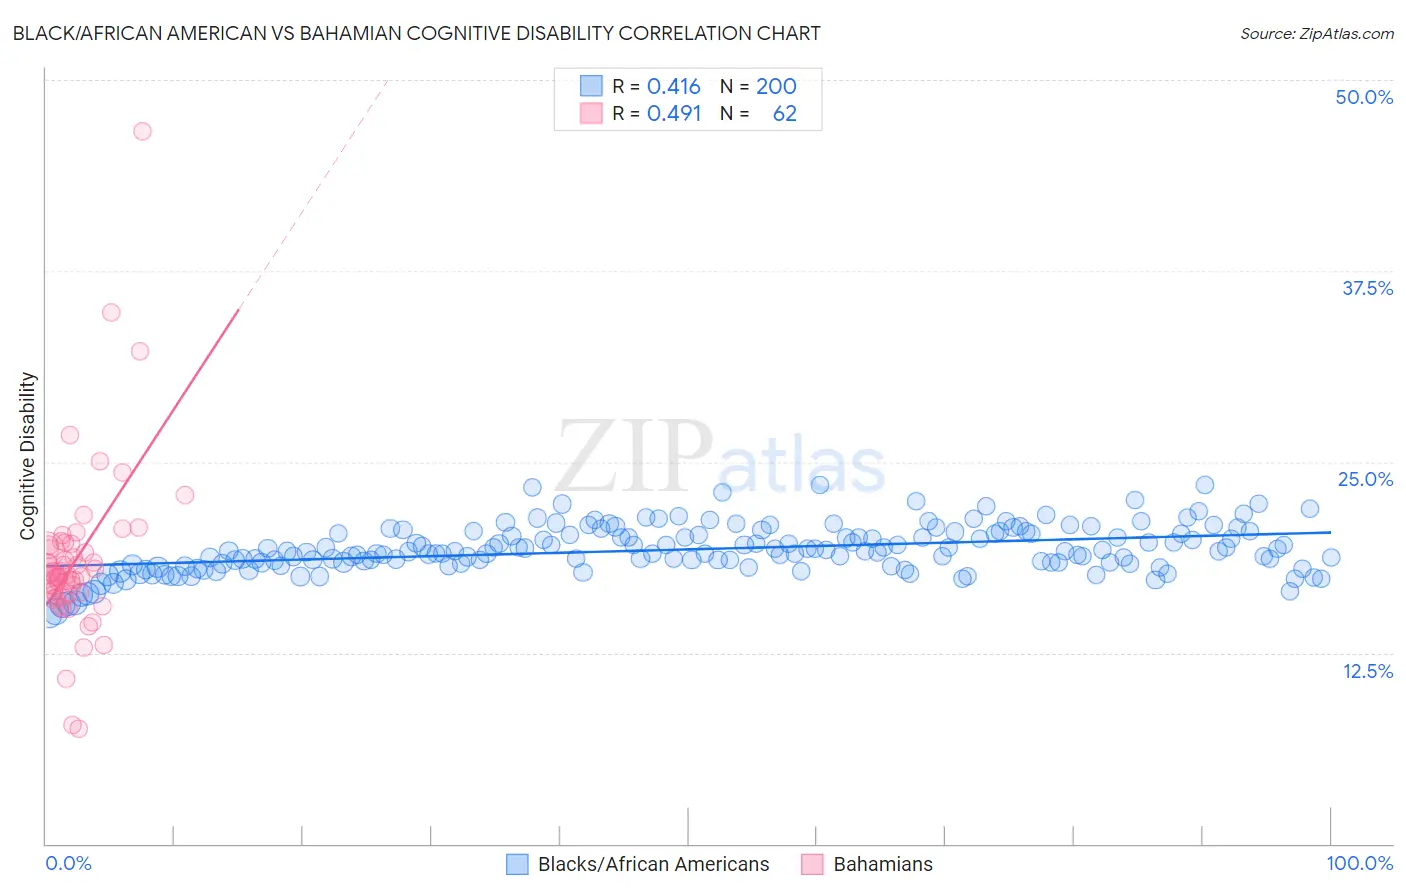
Black/African American vs Bahamian Cognitive Disability Correlation Chart
The statistical analysis conducted on geographies consisting of 565,879,881 people shows a moderate positive correlation between the proportion of Blacks/African Americans and percentage of population with cognitive disability in the United States with a correlation coefficient (R) of 0.416 and weighted average of 19.0%. Similarly, the statistical analysis conducted on geographies consisting of 112,674,908 people shows a moderate positive correlation between the proportion of Bahamians and percentage of population with cognitive disability in the United States with a correlation coefficient (R) of 0.491 and weighted average of 17.9%, a difference of 6.3%.
Cognitive Disability Correlation Summary
| Measurement | Black/African American | Bahamian |
| Minimum | 15.0% | 7.5% |
| Maximum | 23.5% | 46.6% |
| Range | 8.6% | 39.1% |
| Mean | 19.3% | 18.6% |
| Median | 19.1% | 17.6% |
| Interquartile 25% (IQ1) | 18.3% | 16.4% |
| Interquartile 75% (IQ3) | 20.3% | 19.6% |
| Interquartile Range (IQR) | 2.0% | 3.2% |
| Standard Deviation (Sample) | 1.5% | 5.6% |
| Standard Deviation (Population) | 1.5% | 5.6% |
Similar Demographics by Cognitive Disability
Demographics Similar to Blacks/African Americans by Cognitive Disability
In terms of cognitive disability, the demographic groups most similar to Blacks/African Americans are Immigrants from Saudi Arabia (19.1%, a difference of 0.13%), Senegalese (19.0%, a difference of 0.29%), Lumbee (19.1%, a difference of 0.47%), Sudanese (18.9%, a difference of 0.84%), and Puerto Rican (19.2%, a difference of 0.95%).
| Demographics | Rating | Rank | Cognitive Disability |
| Navajo | 0.0 /100 | #329 | Tragic 18.8% |
| Immigrants | Dominican Republic | 0.0 /100 | #330 | Tragic 18.8% |
| Pima | 0.0 /100 | #331 | Tragic 18.8% |
| Immigrants | Sudan | 0.0 /100 | #332 | Tragic 18.8% |
| Immigrants | Yemen | 0.0 /100 | #333 | Tragic 18.8% |
| Sudanese | 0.0 /100 | #334 | Tragic 18.9% |
| Senegalese | 0.0 /100 | #335 | Tragic 19.0% |
| Blacks/African Americans | 0.0 /100 | #336 | Tragic 19.0% |
| Immigrants | Saudi Arabia | 0.0 /100 | #337 | Tragic 19.1% |
| Lumbee | 0.0 /100 | #338 | Tragic 19.1% |
| Puerto Ricans | 0.0 /100 | #339 | Tragic 19.2% |
| Cape Verdeans | 0.0 /100 | #340 | Tragic 19.2% |
| Tohono O'odham | 0.0 /100 | #341 | Tragic 19.3% |
| Houma | 0.0 /100 | #342 | Tragic 19.3% |
| Immigrants | Zaire | 0.0 /100 | #343 | Tragic 19.4% |
Demographics Similar to Bahamians by Cognitive Disability
In terms of cognitive disability, the demographic groups most similar to Bahamians are Immigrants from the Azores (17.9%, a difference of 0.0%), Hopi (17.9%, a difference of 0.010%), Hispanic or Latino (17.9%, a difference of 0.010%), Immigrants from Grenada (17.9%, a difference of 0.020%), and Malaysian (17.9%, a difference of 0.030%).
| Demographics | Rating | Rank | Cognitive Disability |
| Cree | 0.7 /100 | #249 | Tragic 17.9% |
| Immigrants | Ethiopia | 0.7 /100 | #250 | Tragic 17.9% |
| Malaysians | 0.6 /100 | #251 | Tragic 17.9% |
| Immigrants | Grenada | 0.6 /100 | #252 | Tragic 17.9% |
| Hopi | 0.6 /100 | #253 | Tragic 17.9% |
| Hispanics or Latinos | 0.6 /100 | #254 | Tragic 17.9% |
| Immigrants | Azores | 0.6 /100 | #255 | Tragic 17.9% |
| Bahamians | 0.6 /100 | #256 | Tragic 17.9% |
| Mexican American Indians | 0.6 /100 | #257 | Tragic 17.9% |
| Immigrants | Armenia | 0.6 /100 | #258 | Tragic 17.9% |
| Ethiopians | 0.5 /100 | #259 | Tragic 17.9% |
| Immigrants | Belize | 0.5 /100 | #260 | Tragic 17.9% |
| Guamanians/Chamorros | 0.5 /100 | #261 | Tragic 17.9% |
| Sierra Leoneans | 0.4 /100 | #262 | Tragic 17.9% |
| Immigrants | Barbados | 0.4 /100 | #263 | Tragic 17.9% |