Macedonian vs Belgian Disability Age Over 75
COMPARE
Macedonian
Belgian
Disability Age Over 75
Disability Age Over 75 Comparison
Macedonians
Belgians
45.4%
DISABILITY AGE OVER 75
99.9/ 100
METRIC RATING
26th/ 347
METRIC RANK
45.8%
DISABILITY AGE OVER 75
99.7/ 100
METRIC RATING
50th/ 347
METRIC RANK
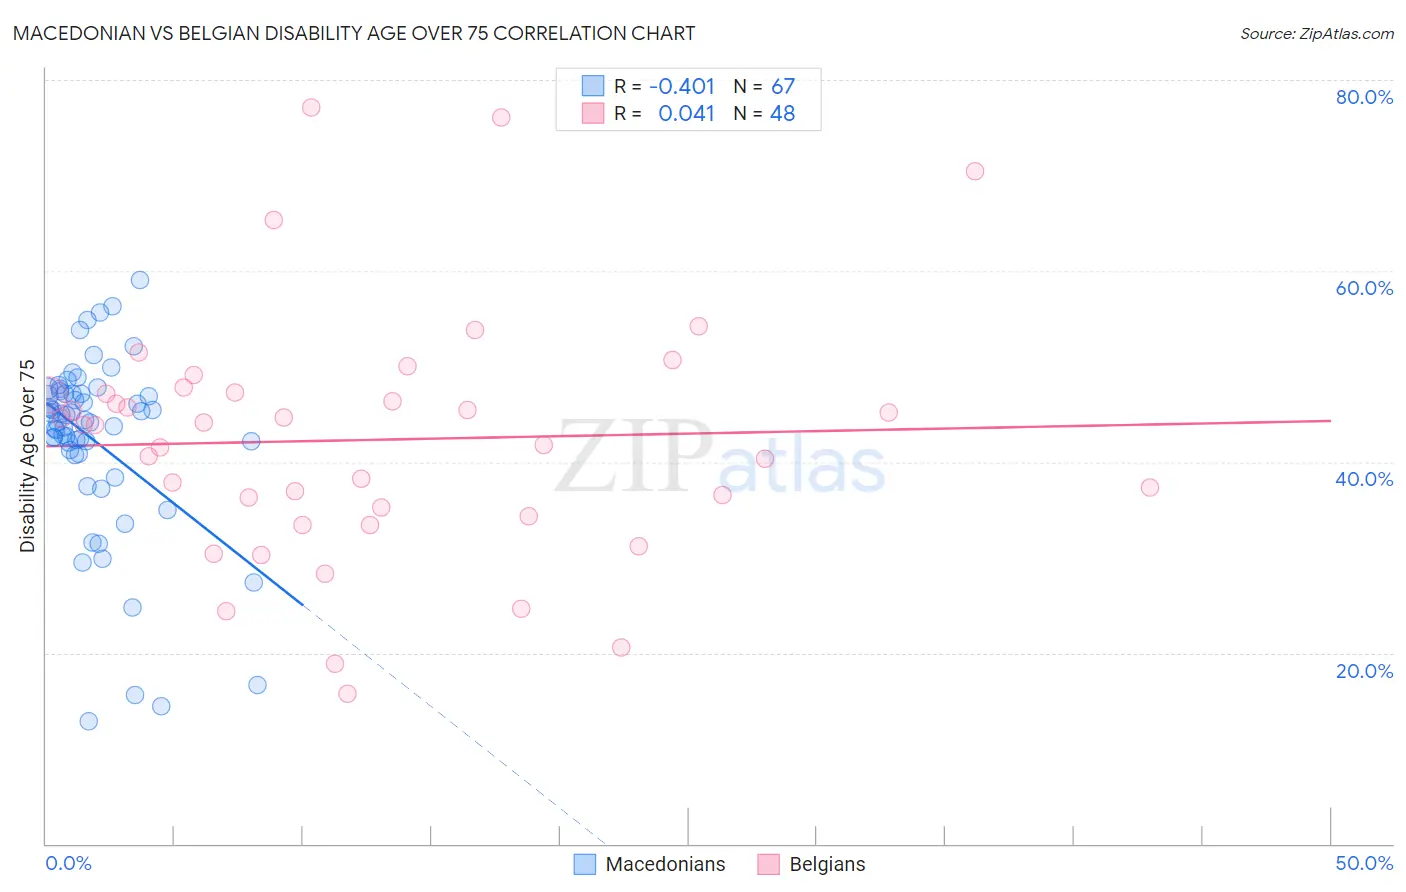
Macedonian vs Belgian Disability Age Over 75 Correlation Chart
The statistical analysis conducted on geographies consisting of 132,585,926 people shows a moderate negative correlation between the proportion of Macedonians and percentage of population with a disability over the age of 75 in the United States with a correlation coefficient (R) of -0.401 and weighted average of 45.4%. Similarly, the statistical analysis conducted on geographies consisting of 355,558,125 people shows no correlation between the proportion of Belgians and percentage of population with a disability over the age of 75 in the United States with a correlation coefficient (R) of 0.041 and weighted average of 45.8%, a difference of 0.87%.
Disability Age Over 75 Correlation Summary
| Measurement | Macedonian | Belgian |
| Minimum | 12.8% | 15.7% |
| Maximum | 59.0% | 77.1% |
| Range | 46.2% | 61.4% |
| Mean | 42.2% | 42.3% |
| Median | 44.3% | 43.8% |
| Interquartile 25% (IQ1) | 40.9% | 34.8% |
| Interquartile 75% (IQ3) | 47.1% | 47.2% |
| Interquartile Range (IQR) | 6.2% | 12.4% |
| Standard Deviation (Sample) | 9.5% | 12.9% |
| Standard Deviation (Population) | 9.5% | 12.8% |
Similar Demographics by Disability Age Over 75
Demographics Similar to Macedonians by Disability Age Over 75
In terms of disability age over 75, the demographic groups most similar to Macedonians are Immigrants from Poland (45.4%, a difference of 0.010%), Immigrants from Bolivia (45.4%, a difference of 0.040%), Thai (45.4%, a difference of 0.040%), Polish (45.3%, a difference of 0.080%), and Filipino (45.4%, a difference of 0.080%).
| Demographics | Rating | Rank | Disability Age Over 75 |
| Immigrants | Greece | 100.0 /100 | #19 | Exceptional 45.2% |
| Immigrants | Serbia | 100.0 /100 | #20 | Exceptional 45.3% |
| Immigrants | Belgium | 100.0 /100 | #21 | Exceptional 45.3% |
| Immigrants | South Africa | 100.0 /100 | #22 | Exceptional 45.3% |
| Immigrants | Switzerland | 99.9 /100 | #23 | Exceptional 45.3% |
| Poles | 99.9 /100 | #24 | Exceptional 45.3% |
| Immigrants | Bolivia | 99.9 /100 | #25 | Exceptional 45.4% |
| Macedonians | 99.9 /100 | #26 | Exceptional 45.4% |
| Immigrants | Poland | 99.9 /100 | #27 | Exceptional 45.4% |
| Thais | 99.9 /100 | #28 | Exceptional 45.4% |
| Filipinos | 99.9 /100 | #29 | Exceptional 45.4% |
| Immigrants | Denmark | 99.9 /100 | #30 | Exceptional 45.4% |
| Immigrants | Bulgaria | 99.9 /100 | #31 | Exceptional 45.5% |
| Immigrants | Australia | 99.9 /100 | #32 | Exceptional 45.5% |
| Immigrants | Croatia | 99.9 /100 | #33 | Exceptional 45.5% |
Demographics Similar to Belgians by Disability Age Over 75
In terms of disability age over 75, the demographic groups most similar to Belgians are Immigrants from Korea (45.8%, a difference of 0.0%), Immigrants from France (45.8%, a difference of 0.050%), Immigrants from Italy (45.8%, a difference of 0.070%), Immigrants from North America (45.7%, a difference of 0.13%), and Slovak (45.8%, a difference of 0.14%).
| Demographics | Rating | Rank | Disability Age Over 75 |
| Czechs | 99.8 /100 | #43 | Exceptional 45.7% |
| Australians | 99.8 /100 | #44 | Exceptional 45.7% |
| Turks | 99.8 /100 | #45 | Exceptional 45.7% |
| Swedes | 99.8 /100 | #46 | Exceptional 45.7% |
| Immigrants | Canada | 99.8 /100 | #47 | Exceptional 45.7% |
| Croatians | 99.8 /100 | #48 | Exceptional 45.7% |
| Immigrants | North America | 99.8 /100 | #49 | Exceptional 45.7% |
| Belgians | 99.7 /100 | #50 | Exceptional 45.8% |
| Immigrants | Korea | 99.7 /100 | #51 | Exceptional 45.8% |
| Immigrants | France | 99.7 /100 | #52 | Exceptional 45.8% |
| Immigrants | Italy | 99.7 /100 | #53 | Exceptional 45.8% |
| Slovaks | 99.6 /100 | #54 | Exceptional 45.8% |
| Maltese | 99.6 /100 | #55 | Exceptional 45.8% |
| Immigrants | Netherlands | 99.6 /100 | #56 | Exceptional 45.9% |
| Immigrants | Turkey | 99.6 /100 | #57 | Exceptional 45.9% |