Ukrainian vs Belgian Disability Age Over 75
COMPARE
Ukrainian
Belgian
Disability Age Over 75
Disability Age Over 75 Comparison
Ukrainians
Belgians
46.4%
DISABILITY AGE OVER 75
97.1/ 100
METRIC RATING
103rd/ 347
METRIC RANK
45.8%
DISABILITY AGE OVER 75
99.7/ 100
METRIC RATING
50th/ 347
METRIC RANK
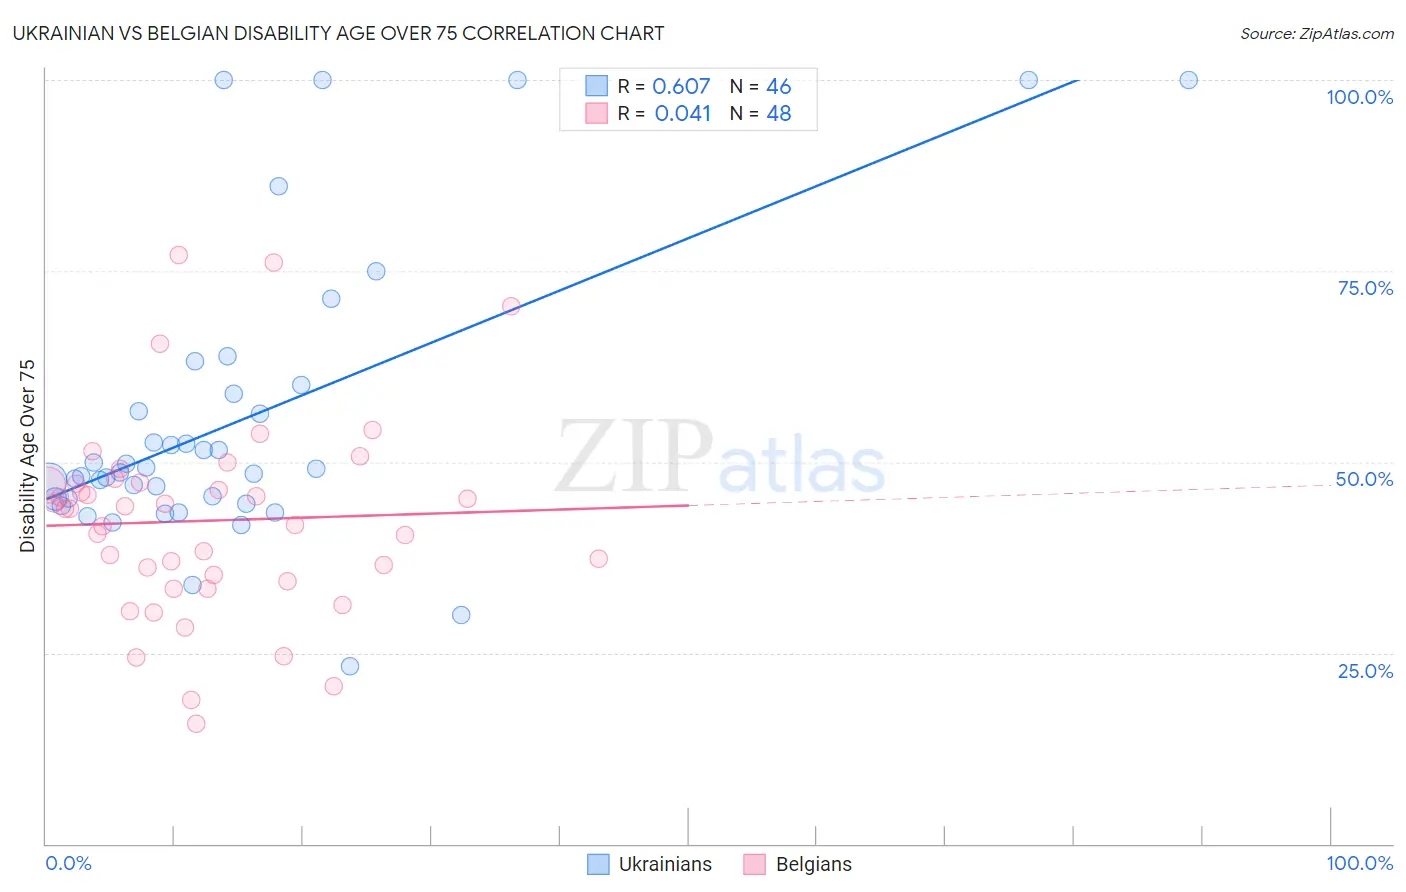
Ukrainian vs Belgian Disability Age Over 75 Correlation Chart
The statistical analysis conducted on geographies consisting of 447,710,922 people shows a significant positive correlation between the proportion of Ukrainians and percentage of population with a disability over the age of 75 in the United States with a correlation coefficient (R) of 0.607 and weighted average of 46.4%. Similarly, the statistical analysis conducted on geographies consisting of 355,558,125 people shows no correlation between the proportion of Belgians and percentage of population with a disability over the age of 75 in the United States with a correlation coefficient (R) of 0.041 and weighted average of 45.8%, a difference of 1.4%.
Disability Age Over 75 Correlation Summary
| Measurement | Ukrainian | Belgian |
| Minimum | 23.2% | 15.7% |
| Maximum | 100.0% | 77.1% |
| Range | 76.8% | 61.4% |
| Mean | 55.4% | 42.3% |
| Median | 48.9% | 43.8% |
| Interquartile 25% (IQ1) | 45.2% | 34.8% |
| Interquartile 75% (IQ3) | 58.8% | 47.2% |
| Interquartile Range (IQR) | 13.7% | 12.4% |
| Standard Deviation (Sample) | 18.9% | 12.9% |
| Standard Deviation (Population) | 18.7% | 12.8% |
Similar Demographics by Disability Age Over 75
Demographics Similar to Ukrainians by Disability Age Over 75
In terms of disability age over 75, the demographic groups most similar to Ukrainians are Immigrants from Malaysia (46.4%, a difference of 0.010%), Israeli (46.4%, a difference of 0.020%), Immigrants from Cameroon (46.4%, a difference of 0.040%), Immigrants from Kuwait (46.4%, a difference of 0.050%), and Immigrants from Uruguay (46.4%, a difference of 0.090%).
| Demographics | Rating | Rank | Disability Age Over 75 |
| Immigrants | China | 98.0 /100 | #96 | Exceptional 46.3% |
| Finns | 97.9 /100 | #97 | Exceptional 46.3% |
| Immigrants | Japan | 97.8 /100 | #98 | Exceptional 46.3% |
| Palestinians | 97.7 /100 | #99 | Exceptional 46.3% |
| Immigrants | Eastern Europe | 97.7 /100 | #100 | Exceptional 46.3% |
| Mongolians | 97.7 /100 | #101 | Exceptional 46.3% |
| Immigrants | Malaysia | 97.1 /100 | #102 | Exceptional 46.4% |
| Ukrainians | 97.1 /100 | #103 | Exceptional 46.4% |
| Israelis | 97.0 /100 | #104 | Exceptional 46.4% |
| Immigrants | Cameroon | 96.9 /100 | #105 | Exceptional 46.4% |
| Immigrants | Kuwait | 96.8 /100 | #106 | Exceptional 46.4% |
| Immigrants | Uruguay | 96.7 /100 | #107 | Exceptional 46.4% |
| Brazilians | 96.6 /100 | #108 | Exceptional 46.5% |
| Chileans | 96.4 /100 | #109 | Exceptional 46.5% |
| Immigrants | Hong Kong | 96.4 /100 | #110 | Exceptional 46.5% |
Demographics Similar to Belgians by Disability Age Over 75
In terms of disability age over 75, the demographic groups most similar to Belgians are Immigrants from Korea (45.8%, a difference of 0.0%), Immigrants from France (45.8%, a difference of 0.050%), Immigrants from Italy (45.8%, a difference of 0.070%), Immigrants from North America (45.7%, a difference of 0.13%), and Slovak (45.8%, a difference of 0.14%).
| Demographics | Rating | Rank | Disability Age Over 75 |
| Czechs | 99.8 /100 | #43 | Exceptional 45.7% |
| Australians | 99.8 /100 | #44 | Exceptional 45.7% |
| Turks | 99.8 /100 | #45 | Exceptional 45.7% |
| Swedes | 99.8 /100 | #46 | Exceptional 45.7% |
| Immigrants | Canada | 99.8 /100 | #47 | Exceptional 45.7% |
| Croatians | 99.8 /100 | #48 | Exceptional 45.7% |
| Immigrants | North America | 99.8 /100 | #49 | Exceptional 45.7% |
| Belgians | 99.7 /100 | #50 | Exceptional 45.8% |
| Immigrants | Korea | 99.7 /100 | #51 | Exceptional 45.8% |
| Immigrants | France | 99.7 /100 | #52 | Exceptional 45.8% |
| Immigrants | Italy | 99.7 /100 | #53 | Exceptional 45.8% |
| Slovaks | 99.6 /100 | #54 | Exceptional 45.8% |
| Maltese | 99.6 /100 | #55 | Exceptional 45.8% |
| Immigrants | Netherlands | 99.6 /100 | #56 | Exceptional 45.9% |
| Immigrants | Turkey | 99.6 /100 | #57 | Exceptional 45.9% |