Immigrants from Belgium vs Asian Disability Age Over 75
COMPARE
Immigrants from Belgium
Asian
Disability Age Over 75
Disability Age Over 75 Comparison
Immigrants from Belgium
Asians
45.3%
DISABILITY AGE OVER 75
100.0/ 100
METRIC RATING
21st/ 347
METRIC RANK
46.9%
DISABILITY AGE OVER 75
81.6/ 100
METRIC RATING
148th/ 347
METRIC RANK
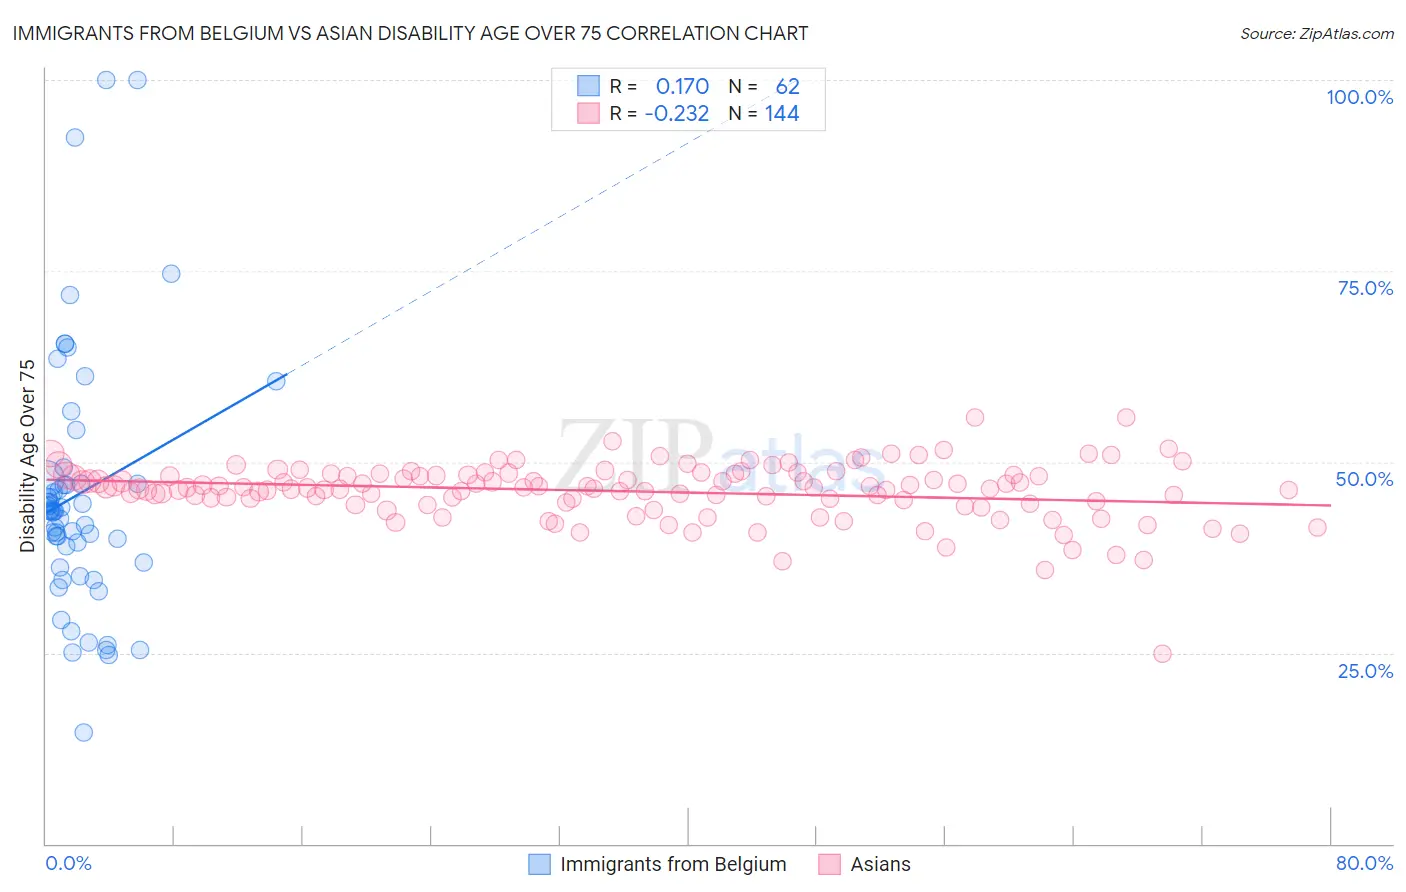
Immigrants from Belgium vs Asian Disability Age Over 75 Correlation Chart
The statistical analysis conducted on geographies consisting of 146,642,839 people shows a poor positive correlation between the proportion of Immigrants from Belgium and percentage of population with a disability over the age of 75 in the United States with a correlation coefficient (R) of 0.170 and weighted average of 45.3%. Similarly, the statistical analysis conducted on geographies consisting of 549,007,730 people shows a weak negative correlation between the proportion of Asians and percentage of population with a disability over the age of 75 in the United States with a correlation coefficient (R) of -0.232 and weighted average of 46.9%, a difference of 3.6%.
Disability Age Over 75 Correlation Summary
| Measurement | Immigrants from Belgium | Asian |
| Minimum | 14.6% | 24.9% |
| Maximum | 100.0% | 55.8% |
| Range | 85.4% | 30.9% |
| Mean | 45.8% | 46.1% |
| Median | 43.6% | 46.6% |
| Interquartile 25% (IQ1) | 36.9% | 44.8% |
| Interquartile 75% (IQ3) | 47.1% | 48.3% |
| Interquartile Range (IQR) | 10.2% | 3.5% |
| Standard Deviation (Sample) | 16.7% | 3.8% |
| Standard Deviation (Population) | 16.5% | 3.8% |
Similar Demographics by Disability Age Over 75
Demographics Similar to Immigrants from Belgium by Disability Age Over 75
In terms of disability age over 75, the demographic groups most similar to Immigrants from Belgium are Immigrants from South Africa (45.3%, a difference of 0.030%), Immigrants from Switzerland (45.3%, a difference of 0.060%), Polish (45.3%, a difference of 0.080%), Immigrants from Bolivia (45.4%, a difference of 0.12%), and Immigrants from Serbia (45.3%, a difference of 0.13%).
| Demographics | Rating | Rank | Disability Age Over 75 |
| Immigrants | Scotland | 100.0 /100 | #14 | Exceptional 45.1% |
| Immigrants | Sweden | 100.0 /100 | #15 | Exceptional 45.1% |
| Immigrants | Northern Europe | 100.0 /100 | #16 | Exceptional 45.2% |
| Immigrants | India | 100.0 /100 | #17 | Exceptional 45.2% |
| Bolivians | 100.0 /100 | #18 | Exceptional 45.2% |
| Immigrants | Greece | 100.0 /100 | #19 | Exceptional 45.2% |
| Immigrants | Serbia | 100.0 /100 | #20 | Exceptional 45.3% |
| Immigrants | Belgium | 100.0 /100 | #21 | Exceptional 45.3% |
| Immigrants | South Africa | 100.0 /100 | #22 | Exceptional 45.3% |
| Immigrants | Switzerland | 99.9 /100 | #23 | Exceptional 45.3% |
| Poles | 99.9 /100 | #24 | Exceptional 45.3% |
| Immigrants | Bolivia | 99.9 /100 | #25 | Exceptional 45.4% |
| Macedonians | 99.9 /100 | #26 | Exceptional 45.4% |
| Immigrants | Poland | 99.9 /100 | #27 | Exceptional 45.4% |
| Thais | 99.9 /100 | #28 | Exceptional 45.4% |
Demographics Similar to Asians by Disability Age Over 75
In terms of disability age over 75, the demographic groups most similar to Asians are Welsh (47.0%, a difference of 0.010%), Immigrants from Russia (47.0%, a difference of 0.080%), French Canadian (47.0%, a difference of 0.090%), Immigrants from Peru (46.9%, a difference of 0.10%), and Guyanese (46.9%, a difference of 0.11%).
| Demographics | Rating | Rank | Disability Age Over 75 |
| Lebanese | 87.0 /100 | #141 | Excellent 46.8% |
| Peruvians | 86.5 /100 | #142 | Excellent 46.8% |
| Bermudans | 85.6 /100 | #143 | Excellent 46.9% |
| Venezuelans | 85.0 /100 | #144 | Excellent 46.9% |
| Costa Ricans | 84.5 /100 | #145 | Excellent 46.9% |
| Guyanese | 84.3 /100 | #146 | Excellent 46.9% |
| Immigrants | Peru | 84.1 /100 | #147 | Excellent 46.9% |
| Asians | 81.6 /100 | #148 | Excellent 46.9% |
| Welsh | 81.3 /100 | #149 | Excellent 47.0% |
| Immigrants | Russia | 79.3 /100 | #150 | Good 47.0% |
| French Canadians | 79.0 /100 | #151 | Good 47.0% |
| Immigrants | Asia | 76.5 /100 | #152 | Good 47.0% |
| Immigrants | Zaire | 74.8 /100 | #153 | Good 47.1% |
| Immigrants | Belarus | 74.8 /100 | #154 | Good 47.1% |
| Immigrants | Iran | 74.7 /100 | #155 | Good 47.1% |