Armenian vs Asian Disability Age Over 75
COMPARE
Armenian
Asian
Disability Age Over 75
Disability Age Over 75 Comparison
Armenians
Asians
50.0%
DISABILITY AGE OVER 75
0.0/ 100
METRIC RATING
297th/ 347
METRIC RANK
46.9%
DISABILITY AGE OVER 75
81.6/ 100
METRIC RATING
148th/ 347
METRIC RANK
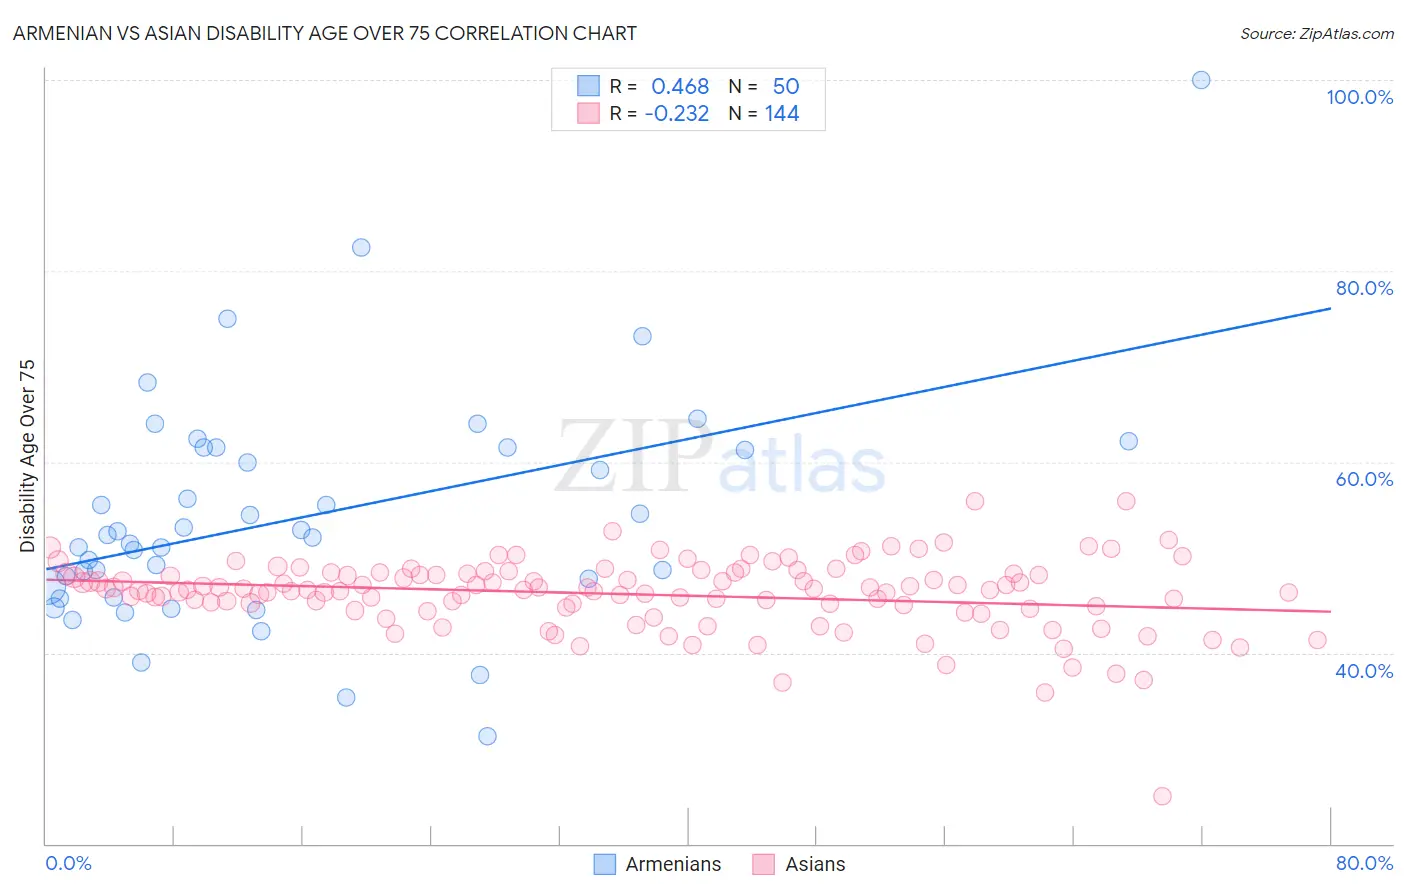
Armenian vs Asian Disability Age Over 75 Correlation Chart
The statistical analysis conducted on geographies consisting of 310,578,172 people shows a moderate positive correlation between the proportion of Armenians and percentage of population with a disability over the age of 75 in the United States with a correlation coefficient (R) of 0.468 and weighted average of 50.0%. Similarly, the statistical analysis conducted on geographies consisting of 549,007,730 people shows a weak negative correlation between the proportion of Asians and percentage of population with a disability over the age of 75 in the United States with a correlation coefficient (R) of -0.232 and weighted average of 46.9%, a difference of 6.6%.
Disability Age Over 75 Correlation Summary
| Measurement | Armenian | Asian |
| Minimum | 31.2% | 24.9% |
| Maximum | 100.0% | 55.8% |
| Range | 68.8% | 30.9% |
| Mean | 54.2% | 46.1% |
| Median | 52.2% | 46.6% |
| Interquartile 25% (IQ1) | 47.0% | 44.8% |
| Interquartile 75% (IQ3) | 61.5% | 48.3% |
| Interquartile Range (IQR) | 14.5% | 3.5% |
| Standard Deviation (Sample) | 12.0% | 3.8% |
| Standard Deviation (Population) | 11.9% | 3.8% |
Similar Demographics by Disability Age Over 75
Demographics Similar to Armenians by Disability Age Over 75
In terms of disability age over 75, the demographic groups most similar to Armenians are Mexican American Indian (50.0%, a difference of 0.030%), Marshallese (50.1%, a difference of 0.050%), Spanish American (50.0%, a difference of 0.060%), Immigrants from Cambodia (50.0%, a difference of 0.10%), and Immigrants from Micronesia (50.1%, a difference of 0.12%).
| Demographics | Rating | Rank | Disability Age Over 75 |
| Puget Sound Salish | 0.0 /100 | #290 | Tragic 49.8% |
| Arapaho | 0.0 /100 | #291 | Tragic 49.8% |
| Shoshone | 0.0 /100 | #292 | Tragic 49.9% |
| Spanish American Indians | 0.0 /100 | #293 | Tragic 49.9% |
| Immigrants | Cambodia | 0.0 /100 | #294 | Tragic 50.0% |
| Spanish Americans | 0.0 /100 | #295 | Tragic 50.0% |
| Mexican American Indians | 0.0 /100 | #296 | Tragic 50.0% |
| Armenians | 0.0 /100 | #297 | Tragic 50.0% |
| Marshallese | 0.0 /100 | #298 | Tragic 50.1% |
| Immigrants | Micronesia | 0.0 /100 | #299 | Tragic 50.1% |
| Cape Verdeans | 0.0 /100 | #300 | Tragic 50.1% |
| Dominicans | 0.0 /100 | #301 | Tragic 50.2% |
| Cherokee | 0.0 /100 | #302 | Tragic 50.2% |
| Japanese | 0.0 /100 | #303 | Tragic 50.2% |
| Immigrants | Dominican Republic | 0.0 /100 | #304 | Tragic 50.3% |
Demographics Similar to Asians by Disability Age Over 75
In terms of disability age over 75, the demographic groups most similar to Asians are Welsh (47.0%, a difference of 0.010%), Immigrants from Russia (47.0%, a difference of 0.080%), French Canadian (47.0%, a difference of 0.090%), Immigrants from Peru (46.9%, a difference of 0.10%), and Guyanese (46.9%, a difference of 0.11%).
| Demographics | Rating | Rank | Disability Age Over 75 |
| Lebanese | 87.0 /100 | #141 | Excellent 46.8% |
| Peruvians | 86.5 /100 | #142 | Excellent 46.8% |
| Bermudans | 85.6 /100 | #143 | Excellent 46.9% |
| Venezuelans | 85.0 /100 | #144 | Excellent 46.9% |
| Costa Ricans | 84.5 /100 | #145 | Excellent 46.9% |
| Guyanese | 84.3 /100 | #146 | Excellent 46.9% |
| Immigrants | Peru | 84.1 /100 | #147 | Excellent 46.9% |
| Asians | 81.6 /100 | #148 | Excellent 46.9% |
| Welsh | 81.3 /100 | #149 | Excellent 47.0% |
| Immigrants | Russia | 79.3 /100 | #150 | Good 47.0% |
| French Canadians | 79.0 /100 | #151 | Good 47.0% |
| Immigrants | Asia | 76.5 /100 | #152 | Good 47.0% |
| Immigrants | Zaire | 74.8 /100 | #153 | Good 47.1% |
| Immigrants | Belarus | 74.8 /100 | #154 | Good 47.1% |
| Immigrants | Iran | 74.7 /100 | #155 | Good 47.1% |