Seminole vs Immigrants from Lithuania Male Disability
COMPARE
Seminole
Immigrants from Lithuania
Male Disability
Male Disability Comparison
Seminole
Immigrants from Lithuania
14.7%
MALE DISABILITY
0.0/ 100
METRIC RATING
332nd/ 347
METRIC RANK
10.5%
MALE DISABILITY
98.9/ 100
METRIC RATING
73rd/ 347
METRIC RANK
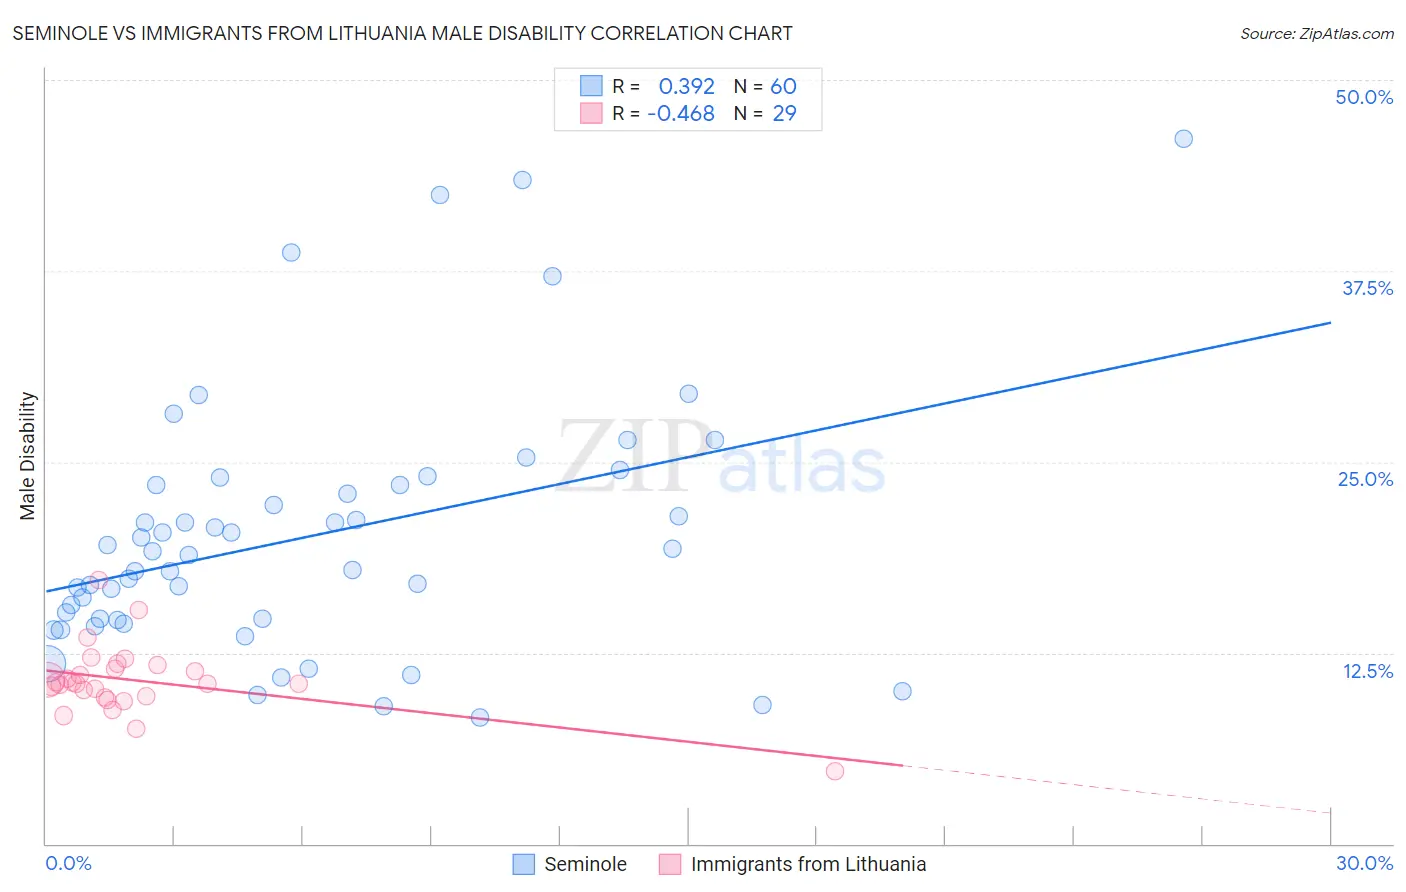
Seminole vs Immigrants from Lithuania Male Disability Correlation Chart
The statistical analysis conducted on geographies consisting of 118,308,545 people shows a mild positive correlation between the proportion of Seminole and percentage of males with a disability in the United States with a correlation coefficient (R) of 0.392 and weighted average of 14.7%. Similarly, the statistical analysis conducted on geographies consisting of 117,723,039 people shows a moderate negative correlation between the proportion of Immigrants from Lithuania and percentage of males with a disability in the United States with a correlation coefficient (R) of -0.468 and weighted average of 10.5%, a difference of 40.0%.
Male Disability Correlation Summary
| Measurement | Seminole | Immigrants from Lithuania |
| Minimum | 8.3% | 4.7% |
| Maximum | 46.2% | 17.2% |
| Range | 37.9% | 12.5% |
| Mean | 20.2% | 10.7% |
| Median | 19.0% | 10.5% |
| Interquartile 25% (IQ1) | 14.7% | 9.6% |
| Interquartile 75% (IQ3) | 23.5% | 11.6% |
| Interquartile Range (IQR) | 8.8% | 2.0% |
| Standard Deviation (Sample) | 8.4% | 2.2% |
| Standard Deviation (Population) | 8.3% | 2.2% |
Similar Demographics by Male Disability
Demographics Similar to Seminole by Male Disability
In terms of male disability, the demographic groups most similar to Seminole are Yuman (14.7%, a difference of 0.10%), Tohono O'odham (14.6%, a difference of 0.78%), Cherokee (14.8%, a difference of 0.78%), Dutch West Indian (14.8%, a difference of 0.80%), and Alaskan Athabascan (14.9%, a difference of 1.3%).
| Demographics | Rating | Rank | Male Disability |
| Ottawa | 0.0 /100 | #325 | Tragic 14.1% |
| Natives/Alaskans | 0.0 /100 | #326 | Tragic 14.2% |
| Potawatomi | 0.0 /100 | #327 | Tragic 14.2% |
| Chippewa | 0.0 /100 | #328 | Tragic 14.3% |
| Cajuns | 0.0 /100 | #329 | Tragic 14.4% |
| Navajo | 0.0 /100 | #330 | Tragic 14.4% |
| Tohono O'odham | 0.0 /100 | #331 | Tragic 14.6% |
| Seminole | 0.0 /100 | #332 | Tragic 14.7% |
| Yuman | 0.0 /100 | #333 | Tragic 14.7% |
| Cherokee | 0.0 /100 | #334 | Tragic 14.8% |
| Dutch West Indians | 0.0 /100 | #335 | Tragic 14.8% |
| Alaskan Athabascans | 0.0 /100 | #336 | Tragic 14.9% |
| Menominee | 0.0 /100 | #337 | Tragic 15.0% |
| Pueblo | 0.0 /100 | #338 | Tragic 15.0% |
| Chickasaw | 0.0 /100 | #339 | Tragic 15.1% |
Demographics Similar to Immigrants from Lithuania by Male Disability
In terms of male disability, the demographic groups most similar to Immigrants from Lithuania are Immigrants from Serbia (10.5%, a difference of 0.060%), Immigrants from Cameroon (10.5%, a difference of 0.12%), Immigrants from Lebanon (10.5%, a difference of 0.14%), Sierra Leonean (10.5%, a difference of 0.26%), and Immigrants from Bulgaria (10.5%, a difference of 0.27%).
| Demographics | Rating | Rank | Male Disability |
| Guyanese | 99.2 /100 | #66 | Exceptional 10.5% |
| Immigrants | Afghanistan | 99.2 /100 | #67 | Exceptional 10.5% |
| Colombians | 99.2 /100 | #68 | Exceptional 10.5% |
| Ecuadorians | 99.2 /100 | #69 | Exceptional 10.5% |
| Immigrants | Bulgaria | 99.1 /100 | #70 | Exceptional 10.5% |
| Immigrants | Cameroon | 99.0 /100 | #71 | Exceptional 10.5% |
| Immigrants | Serbia | 99.0 /100 | #72 | Exceptional 10.5% |
| Immigrants | Lithuania | 98.9 /100 | #73 | Exceptional 10.5% |
| Immigrants | Lebanon | 98.8 /100 | #74 | Exceptional 10.5% |
| Sierra Leoneans | 98.7 /100 | #75 | Exceptional 10.5% |
| Immigrants | Sierra Leone | 98.7 /100 | #76 | Exceptional 10.5% |
| Laotians | 98.6 /100 | #77 | Exceptional 10.6% |
| Immigrants | Russia | 98.6 /100 | #78 | Exceptional 10.6% |
| Zimbabweans | 98.4 /100 | #79 | Exceptional 10.6% |
| Immigrants | Jordan | 98.4 /100 | #80 | Exceptional 10.6% |