Paraguayan vs Immigrants from Lithuania Male Disability
COMPARE
Paraguayan
Immigrants from Lithuania
Male Disability
Male Disability Comparison
Paraguayans
Immigrants from Lithuania
10.1%
MALE DISABILITY
99.9/ 100
METRIC RATING
26th/ 347
METRIC RANK
10.5%
MALE DISABILITY
98.9/ 100
METRIC RATING
73rd/ 347
METRIC RANK
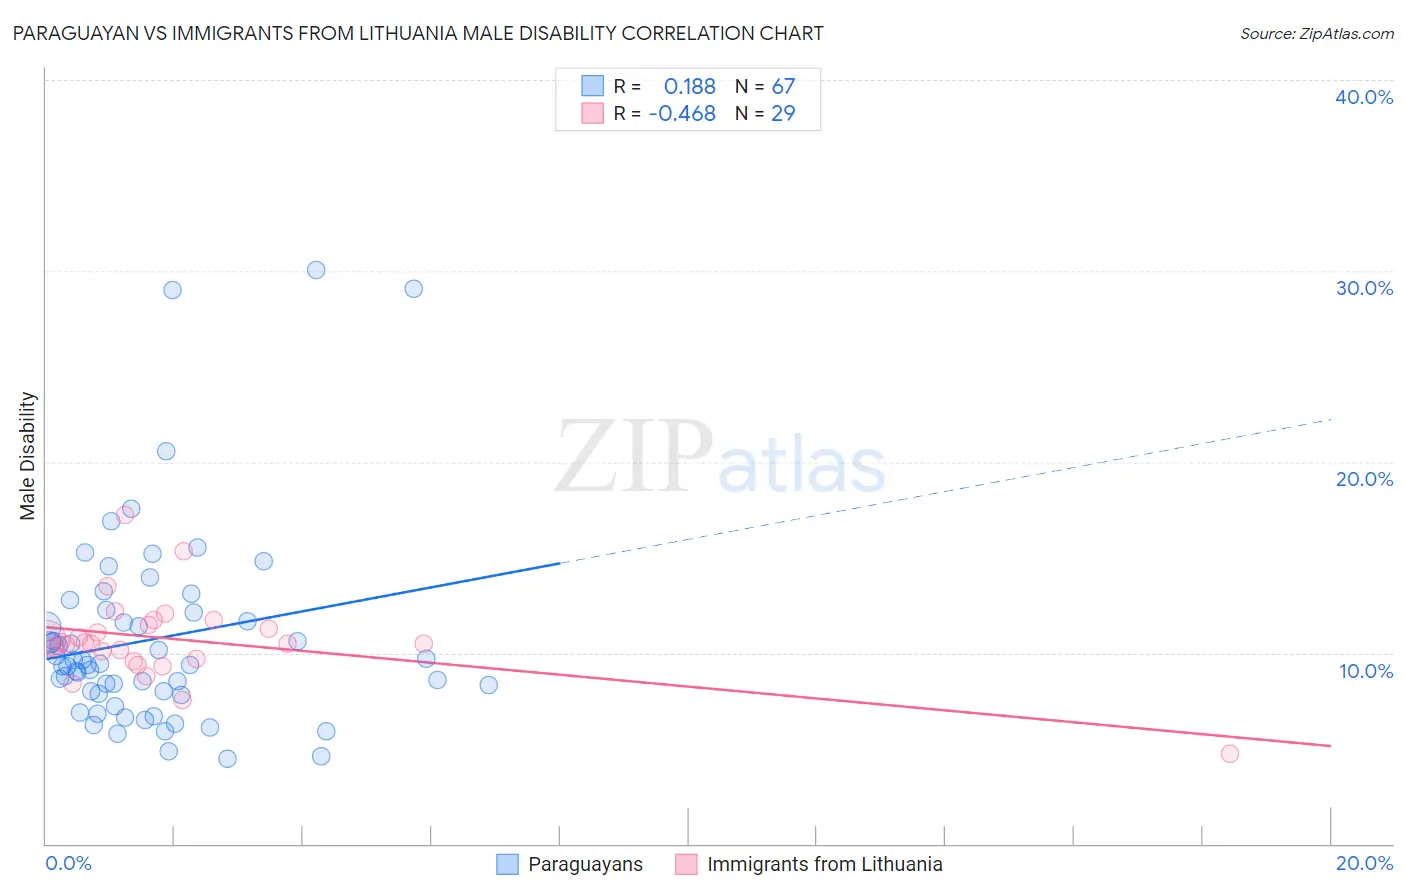
Paraguayan vs Immigrants from Lithuania Male Disability Correlation Chart
The statistical analysis conducted on geographies consisting of 95,111,700 people shows a poor positive correlation between the proportion of Paraguayans and percentage of males with a disability in the United States with a correlation coefficient (R) of 0.188 and weighted average of 10.1%. Similarly, the statistical analysis conducted on geographies consisting of 117,723,039 people shows a moderate negative correlation between the proportion of Immigrants from Lithuania and percentage of males with a disability in the United States with a correlation coefficient (R) of -0.468 and weighted average of 10.5%, a difference of 4.5%.
Male Disability Correlation Summary
| Measurement | Paraguayan | Immigrants from Lithuania |
| Minimum | 4.4% | 4.7% |
| Maximum | 30.1% | 17.2% |
| Range | 25.6% | 12.5% |
| Mean | 10.7% | 10.7% |
| Median | 9.4% | 10.5% |
| Interquartile 25% (IQ1) | 7.9% | 9.6% |
| Interquartile 75% (IQ3) | 12.1% | 11.6% |
| Interquartile Range (IQR) | 4.2% | 2.0% |
| Standard Deviation (Sample) | 5.2% | 2.2% |
| Standard Deviation (Population) | 5.2% | 2.2% |
Similar Demographics by Male Disability
Demographics Similar to Paraguayans by Male Disability
In terms of male disability, the demographic groups most similar to Paraguayans are Immigrants from Malaysia (10.0%, a difference of 0.13%), Immigrants from Asia (10.0%, a difference of 0.32%), Egyptian (10.1%, a difference of 0.32%), Vietnamese (10.1%, a difference of 0.34%), and Cypriot (10.0%, a difference of 0.45%).
| Demographics | Rating | Rank | Male Disability |
| Immigrants | Sri Lanka | 100.0 /100 | #19 | Exceptional 10.0% |
| Asians | 100.0 /100 | #20 | Exceptional 10.0% |
| Burmese | 100.0 /100 | #21 | Exceptional 10.0% |
| Immigrants | Venezuela | 100.0 /100 | #22 | Exceptional 10.0% |
| Cypriots | 100.0 /100 | #23 | Exceptional 10.0% |
| Immigrants | Asia | 100.0 /100 | #24 | Exceptional 10.0% |
| Immigrants | Malaysia | 99.9 /100 | #25 | Exceptional 10.0% |
| Paraguayans | 99.9 /100 | #26 | Exceptional 10.1% |
| Egyptians | 99.9 /100 | #27 | Exceptional 10.1% |
| Vietnamese | 99.9 /100 | #28 | Exceptional 10.1% |
| Venezuelans | 99.9 /100 | #29 | Exceptional 10.1% |
| Immigrants | Egypt | 99.9 /100 | #30 | Exceptional 10.1% |
| Soviet Union | 99.9 /100 | #31 | Exceptional 10.1% |
| Argentineans | 99.9 /100 | #32 | Exceptional 10.1% |
| Immigrants | Ethiopia | 99.9 /100 | #33 | Exceptional 10.2% |
Demographics Similar to Immigrants from Lithuania by Male Disability
In terms of male disability, the demographic groups most similar to Immigrants from Lithuania are Immigrants from Serbia (10.5%, a difference of 0.060%), Immigrants from Cameroon (10.5%, a difference of 0.12%), Immigrants from Lebanon (10.5%, a difference of 0.14%), Sierra Leonean (10.5%, a difference of 0.26%), and Immigrants from Bulgaria (10.5%, a difference of 0.27%).
| Demographics | Rating | Rank | Male Disability |
| Guyanese | 99.2 /100 | #66 | Exceptional 10.5% |
| Immigrants | Afghanistan | 99.2 /100 | #67 | Exceptional 10.5% |
| Colombians | 99.2 /100 | #68 | Exceptional 10.5% |
| Ecuadorians | 99.2 /100 | #69 | Exceptional 10.5% |
| Immigrants | Bulgaria | 99.1 /100 | #70 | Exceptional 10.5% |
| Immigrants | Cameroon | 99.0 /100 | #71 | Exceptional 10.5% |
| Immigrants | Serbia | 99.0 /100 | #72 | Exceptional 10.5% |
| Immigrants | Lithuania | 98.9 /100 | #73 | Exceptional 10.5% |
| Immigrants | Lebanon | 98.8 /100 | #74 | Exceptional 10.5% |
| Sierra Leoneans | 98.7 /100 | #75 | Exceptional 10.5% |
| Immigrants | Sierra Leone | 98.7 /100 | #76 | Exceptional 10.5% |
| Laotians | 98.6 /100 | #77 | Exceptional 10.6% |
| Immigrants | Russia | 98.6 /100 | #78 | Exceptional 10.6% |
| Zimbabweans | 98.4 /100 | #79 | Exceptional 10.6% |
| Immigrants | Jordan | 98.4 /100 | #80 | Exceptional 10.6% |