Polish vs Immigrants from Lithuania Male Disability
COMPARE
Polish
Immigrants from Lithuania
Male Disability
Male Disability Comparison
Poles
Immigrants from Lithuania
12.0%
MALE DISABILITY
0.7/ 100
METRIC RATING
248th/ 347
METRIC RANK
10.5%
MALE DISABILITY
98.9/ 100
METRIC RATING
73rd/ 347
METRIC RANK
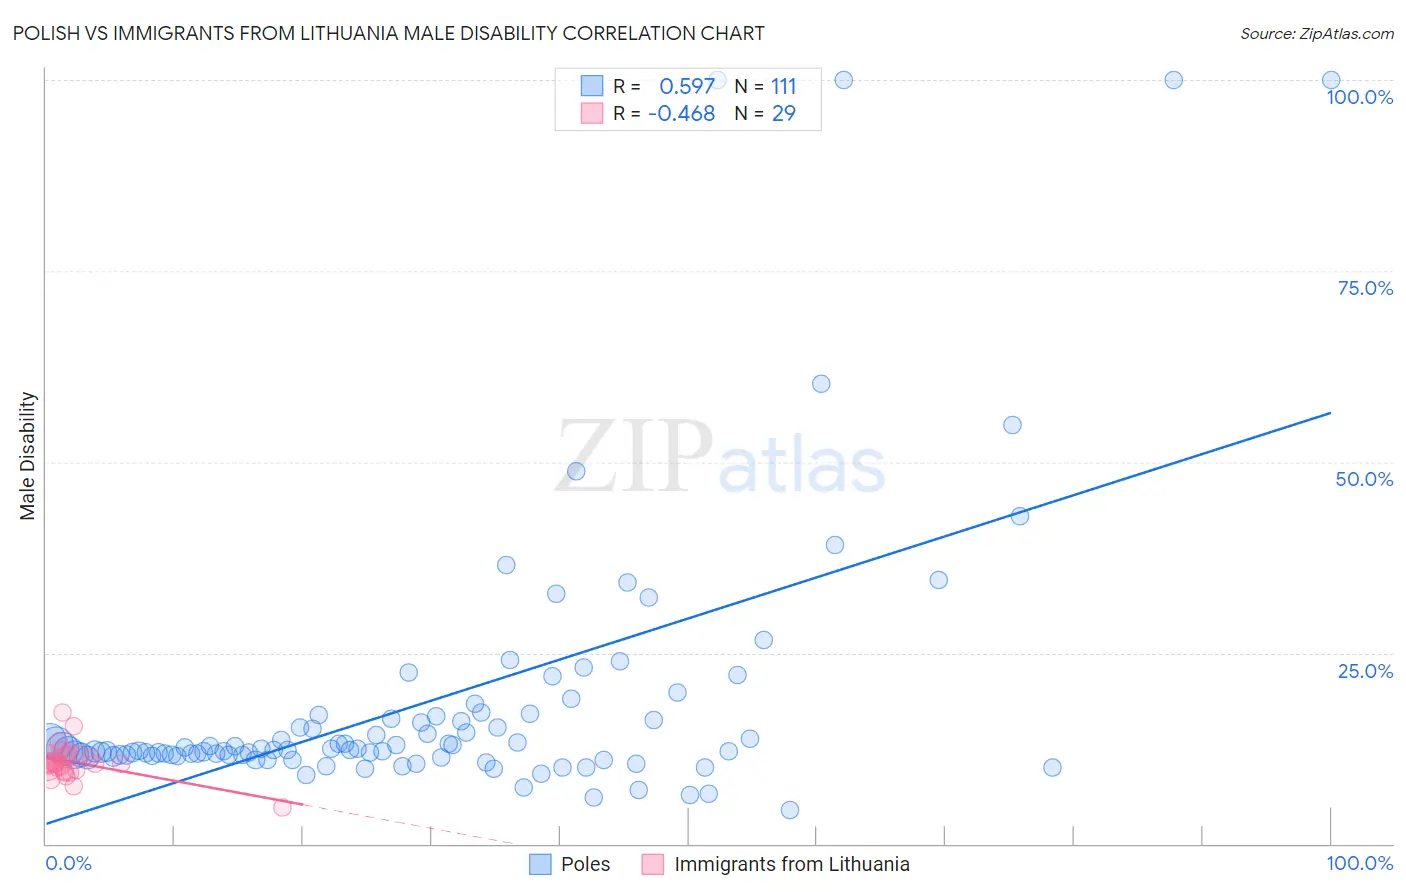
Polish vs Immigrants from Lithuania Male Disability Correlation Chart
The statistical analysis conducted on geographies consisting of 560,313,997 people shows a substantial positive correlation between the proportion of Poles and percentage of males with a disability in the United States with a correlation coefficient (R) of 0.597 and weighted average of 12.0%. Similarly, the statistical analysis conducted on geographies consisting of 117,723,039 people shows a moderate negative correlation between the proportion of Immigrants from Lithuania and percentage of males with a disability in the United States with a correlation coefficient (R) of -0.468 and weighted average of 10.5%, a difference of 14.0%.
Male Disability Correlation Summary
| Measurement | Polish | Immigrants from Lithuania |
| Minimum | 4.3% | 4.7% |
| Maximum | 100.0% | 17.2% |
| Range | 95.7% | 12.5% |
| Mean | 18.7% | 10.7% |
| Median | 12.3% | 10.5% |
| Interquartile 25% (IQ1) | 11.5% | 9.6% |
| Interquartile 75% (IQ3) | 16.7% | 11.6% |
| Interquartile Range (IQR) | 5.2% | 2.0% |
| Standard Deviation (Sample) | 18.4% | 2.2% |
| Standard Deviation (Population) | 18.3% | 2.2% |
Similar Demographics by Male Disability
Demographics Similar to Poles by Male Disability
In terms of male disability, the demographic groups most similar to Poles are Hungarian (12.0%, a difference of 0.18%), Danish (11.9%, a difference of 0.36%), Immigrants from Yemen (12.0%, a difference of 0.36%), Immigrants from Laos (11.9%, a difference of 0.40%), and Immigrants from Liberia (11.9%, a difference of 0.40%).
| Demographics | Rating | Rank | Male Disability |
| Bahamians | 1.1 /100 | #241 | Tragic 11.9% |
| Northern Europeans | 1.1 /100 | #242 | Tragic 11.9% |
| Samoans | 1.1 /100 | #243 | Tragic 11.9% |
| Immigrants | Laos | 1.0 /100 | #244 | Tragic 11.9% |
| Immigrants | Liberia | 1.0 /100 | #245 | Tragic 11.9% |
| Danes | 0.9 /100 | #246 | Tragic 11.9% |
| Hungarians | 0.8 /100 | #247 | Tragic 12.0% |
| Poles | 0.7 /100 | #248 | Tragic 12.0% |
| Immigrants | Yemen | 0.5 /100 | #249 | Tragic 12.0% |
| Bangladeshis | 0.5 /100 | #250 | Tragic 12.0% |
| German Russians | 0.5 /100 | #251 | Tragic 12.0% |
| Slovenes | 0.5 /100 | #252 | Tragic 12.0% |
| Guamanians/Chamorros | 0.5 /100 | #253 | Tragic 12.0% |
| British | 0.4 /100 | #254 | Tragic 12.1% |
| Chinese | 0.4 /100 | #255 | Tragic 12.1% |
Demographics Similar to Immigrants from Lithuania by Male Disability
In terms of male disability, the demographic groups most similar to Immigrants from Lithuania are Immigrants from Serbia (10.5%, a difference of 0.060%), Immigrants from Cameroon (10.5%, a difference of 0.12%), Immigrants from Lebanon (10.5%, a difference of 0.14%), Sierra Leonean (10.5%, a difference of 0.26%), and Immigrants from Bulgaria (10.5%, a difference of 0.27%).
| Demographics | Rating | Rank | Male Disability |
| Guyanese | 99.2 /100 | #66 | Exceptional 10.5% |
| Immigrants | Afghanistan | 99.2 /100 | #67 | Exceptional 10.5% |
| Colombians | 99.2 /100 | #68 | Exceptional 10.5% |
| Ecuadorians | 99.2 /100 | #69 | Exceptional 10.5% |
| Immigrants | Bulgaria | 99.1 /100 | #70 | Exceptional 10.5% |
| Immigrants | Cameroon | 99.0 /100 | #71 | Exceptional 10.5% |
| Immigrants | Serbia | 99.0 /100 | #72 | Exceptional 10.5% |
| Immigrants | Lithuania | 98.9 /100 | #73 | Exceptional 10.5% |
| Immigrants | Lebanon | 98.8 /100 | #74 | Exceptional 10.5% |
| Sierra Leoneans | 98.7 /100 | #75 | Exceptional 10.5% |
| Immigrants | Sierra Leone | 98.7 /100 | #76 | Exceptional 10.5% |
| Laotians | 98.6 /100 | #77 | Exceptional 10.6% |
| Immigrants | Russia | 98.6 /100 | #78 | Exceptional 10.6% |
| Zimbabweans | 98.4 /100 | #79 | Exceptional 10.6% |
| Immigrants | Jordan | 98.4 /100 | #80 | Exceptional 10.6% |