Blackfeet vs Chippewa Disability Age Under 5
COMPARE
Blackfeet
Chippewa
Disability Age Under 5
Disability Age Under 5 Comparison
Blackfeet
Chippewa
1.6%
DISABILITY AGE UNDER 5
0.0/ 100
METRIC RATING
305th/ 347
METRIC RANK
1.9%
DISABILITY AGE UNDER 5
0.0/ 100
METRIC RATING
332nd/ 347
METRIC RANK
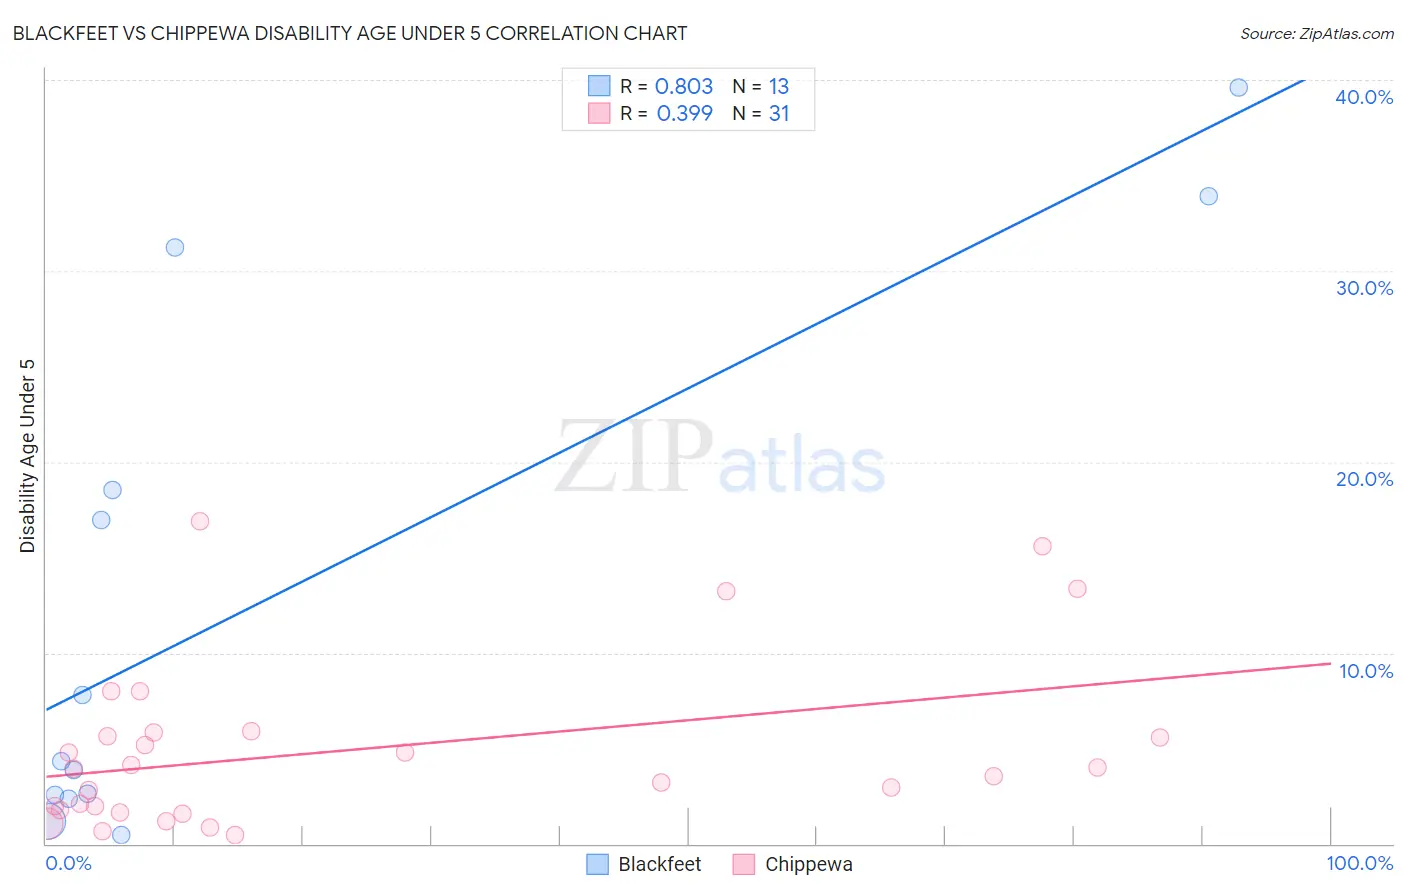
Blackfeet vs Chippewa Disability Age Under 5 Correlation Chart
The statistical analysis conducted on geographies consisting of 184,518,312 people shows a very strong positive correlation between the proportion of Blackfeet and percentage of population with a disability under the age of 5 in the United States with a correlation coefficient (R) of 0.803 and weighted average of 1.6%. Similarly, the statistical analysis conducted on geographies consisting of 140,016,256 people shows a mild positive correlation between the proportion of Chippewa and percentage of population with a disability under the age of 5 in the United States with a correlation coefficient (R) of 0.399 and weighted average of 1.9%, a difference of 14.3%.
Disability Age Under 5 Correlation Summary
| Measurement | Blackfeet | Chippewa |
| Minimum | 0.46% | 0.43% |
| Maximum | 39.6% | 16.9% |
| Range | 39.1% | 16.5% |
| Mean | 12.7% | 4.9% |
| Median | 4.4% | 3.9% |
| Interquartile 25% (IQ1) | 2.4% | 1.8% |
| Interquartile 75% (IQ3) | 24.9% | 5.8% |
| Interquartile Range (IQR) | 22.5% | 4.0% |
| Standard Deviation (Sample) | 14.0% | 4.4% |
| Standard Deviation (Population) | 13.4% | 4.3% |
Similar Demographics by Disability Age Under 5
Demographics Similar to Blackfeet by Disability Age Under 5
In terms of disability age under 5, the demographic groups most similar to Blackfeet are Creek (1.6%, a difference of 0.040%), Scottish (1.6%, a difference of 0.10%), Seminole (1.6%, a difference of 0.16%), Navajo (1.6%, a difference of 0.25%), and Swiss (1.6%, a difference of 0.79%).
| Demographics | Rating | Rank | Disability Age Under 5 |
| Cajuns | 0.0 /100 | #298 | Tragic 1.6% |
| Portuguese | 0.0 /100 | #299 | Tragic 1.6% |
| Shoshone | 0.0 /100 | #300 | Tragic 1.6% |
| German Russians | 0.0 /100 | #301 | Tragic 1.6% |
| Welsh | 0.0 /100 | #302 | Tragic 1.6% |
| Swiss | 0.0 /100 | #303 | Tragic 1.6% |
| Seminole | 0.0 /100 | #304 | Tragic 1.6% |
| Blackfeet | 0.0 /100 | #305 | Tragic 1.6% |
| Creek | 0.0 /100 | #306 | Tragic 1.6% |
| Scottish | 0.0 /100 | #307 | Tragic 1.6% |
| Navajo | 0.0 /100 | #308 | Tragic 1.6% |
| Cape Verdeans | 0.0 /100 | #309 | Tragic 1.7% |
| Whites/Caucasians | 0.0 /100 | #310 | Tragic 1.7% |
| English | 0.0 /100 | #311 | Tragic 1.7% |
| Puerto Ricans | 0.0 /100 | #312 | Tragic 1.7% |
Demographics Similar to Chippewa by Disability Age Under 5
In terms of disability age under 5, the demographic groups most similar to Chippewa are French Canadian (1.9%, a difference of 0.060%), Choctaw (1.9%, a difference of 0.36%), Houma (1.9%, a difference of 0.69%), American (1.9%, a difference of 1.2%), and Osage (1.8%, a difference of 2.9%).
| Demographics | Rating | Rank | Disability Age Under 5 |
| Immigrants | Portugal | 0.0 /100 | #325 | Tragic 1.8% |
| Sioux | 0.0 /100 | #326 | Tragic 1.8% |
| Osage | 0.0 /100 | #327 | Tragic 1.8% |
| Americans | 0.0 /100 | #328 | Tragic 1.9% |
| Houma | 0.0 /100 | #329 | Tragic 1.9% |
| Choctaw | 0.0 /100 | #330 | Tragic 1.9% |
| French Canadians | 0.0 /100 | #331 | Tragic 1.9% |
| Chippewa | 0.0 /100 | #332 | Tragic 1.9% |
| Dutch West Indians | 0.0 /100 | #333 | Tragic 1.9% |
| Natives/Alaskans | 0.0 /100 | #334 | Tragic 1.9% |
| Pennsylvania Germans | 0.0 /100 | #335 | Tragic 1.9% |
| Paraguayans | 0.0 /100 | #336 | Tragic 2.0% |
| Apache | 0.0 /100 | #337 | Tragic 2.0% |
| Tohono O'odham | 0.0 /100 | #338 | Tragic 2.2% |
| Immigrants | Azores | 0.0 /100 | #339 | Tragic 2.2% |