Blackfeet vs Luxembourger Disability Age Under 5
COMPARE
Blackfeet
Luxembourger
Disability Age Under 5
Disability Age Under 5 Comparison
Blackfeet
Luxembourgers
1.6%
DISABILITY AGE UNDER 5
0.0/ 100
METRIC RATING
305th/ 347
METRIC RANK
1.3%
DISABILITY AGE UNDER 5
6.1/ 100
METRIC RATING
228th/ 347
METRIC RANK
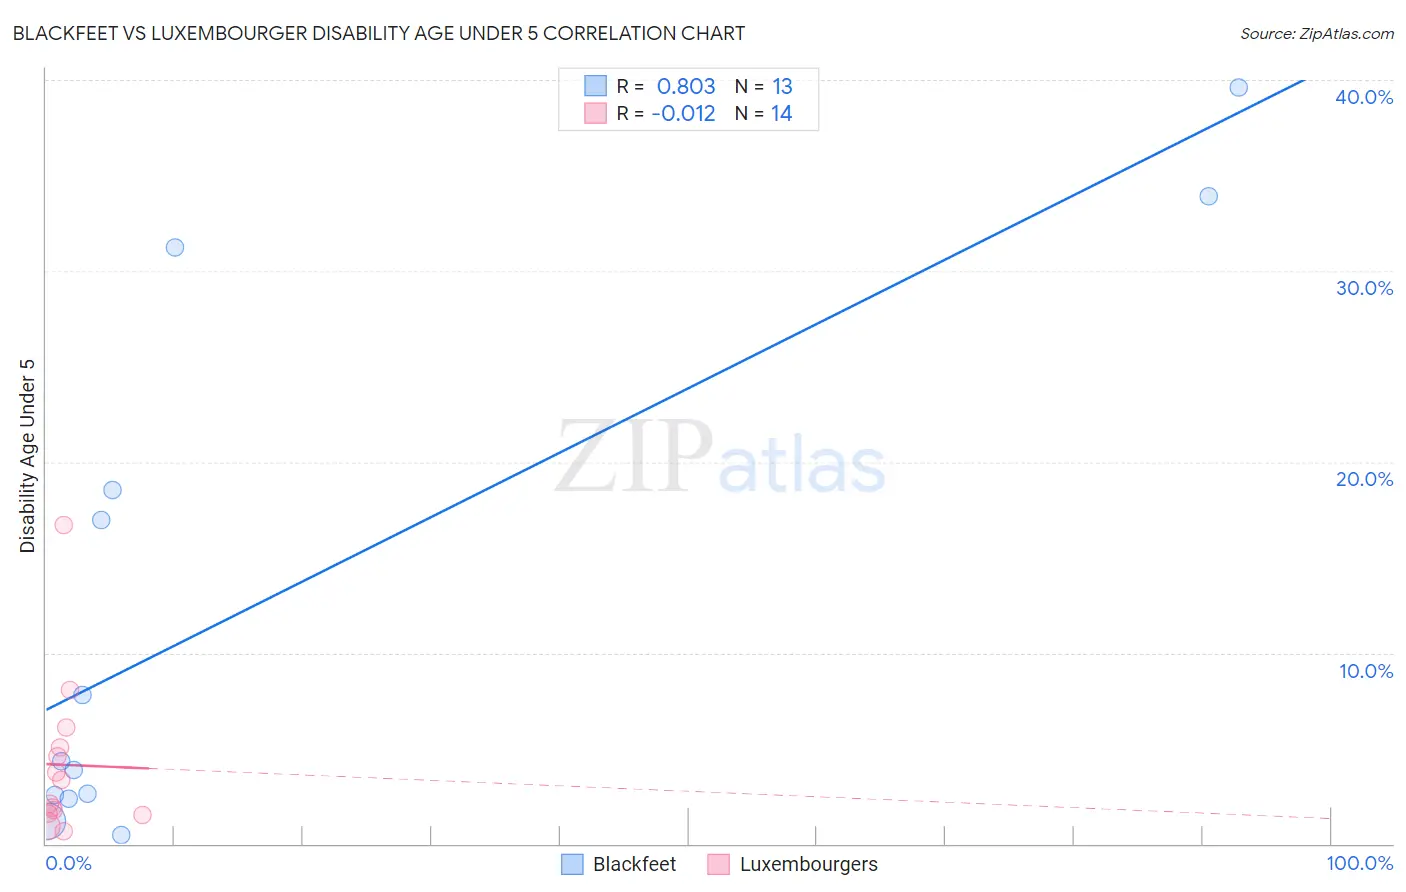
Blackfeet vs Luxembourger Disability Age Under 5 Correlation Chart
The statistical analysis conducted on geographies consisting of 184,518,312 people shows a very strong positive correlation between the proportion of Blackfeet and percentage of population with a disability under the age of 5 in the United States with a correlation coefficient (R) of 0.803 and weighted average of 1.6%. Similarly, the statistical analysis conducted on geographies consisting of 100,355,478 people shows no correlation between the proportion of Luxembourgers and percentage of population with a disability under the age of 5 in the United States with a correlation coefficient (R) of -0.012 and weighted average of 1.3%, a difference of 24.9%.
Disability Age Under 5 Correlation Summary
| Measurement | Blackfeet | Luxembourger |
| Minimum | 0.46% | 0.63% |
| Maximum | 39.6% | 16.7% |
| Range | 39.1% | 16.0% |
| Mean | 12.7% | 4.1% |
| Median | 4.4% | 2.7% |
| Interquartile 25% (IQ1) | 2.4% | 1.6% |
| Interquartile 75% (IQ3) | 24.9% | 5.0% |
| Interquartile Range (IQR) | 22.5% | 3.5% |
| Standard Deviation (Sample) | 14.0% | 4.2% |
| Standard Deviation (Population) | 13.4% | 4.0% |
Similar Demographics by Disability Age Under 5
Demographics Similar to Blackfeet by Disability Age Under 5
In terms of disability age under 5, the demographic groups most similar to Blackfeet are Creek (1.6%, a difference of 0.040%), Scottish (1.6%, a difference of 0.10%), Seminole (1.6%, a difference of 0.16%), Navajo (1.6%, a difference of 0.25%), and Swiss (1.6%, a difference of 0.79%).
| Demographics | Rating | Rank | Disability Age Under 5 |
| Cajuns | 0.0 /100 | #298 | Tragic 1.6% |
| Portuguese | 0.0 /100 | #299 | Tragic 1.6% |
| Shoshone | 0.0 /100 | #300 | Tragic 1.6% |
| German Russians | 0.0 /100 | #301 | Tragic 1.6% |
| Welsh | 0.0 /100 | #302 | Tragic 1.6% |
| Swiss | 0.0 /100 | #303 | Tragic 1.6% |
| Seminole | 0.0 /100 | #304 | Tragic 1.6% |
| Blackfeet | 0.0 /100 | #305 | Tragic 1.6% |
| Creek | 0.0 /100 | #306 | Tragic 1.6% |
| Scottish | 0.0 /100 | #307 | Tragic 1.6% |
| Navajo | 0.0 /100 | #308 | Tragic 1.6% |
| Cape Verdeans | 0.0 /100 | #309 | Tragic 1.7% |
| Whites/Caucasians | 0.0 /100 | #310 | Tragic 1.7% |
| English | 0.0 /100 | #311 | Tragic 1.7% |
| Puerto Ricans | 0.0 /100 | #312 | Tragic 1.7% |
Demographics Similar to Luxembourgers by Disability Age Under 5
In terms of disability age under 5, the demographic groups most similar to Luxembourgers are Taiwanese (1.3%, a difference of 0.010%), Immigrants from Costa Rica (1.3%, a difference of 0.21%), Lebanese (1.3%, a difference of 0.31%), Panamanian (1.3%, a difference of 0.35%), and Bahamian (1.3%, a difference of 0.35%).
| Demographics | Rating | Rank | Disability Age Under 5 |
| Sub-Saharan Africans | 8.3 /100 | #221 | Tragic 1.3% |
| Ukrainians | 8.3 /100 | #222 | Tragic 1.3% |
| Hispanics or Latinos | 7.7 /100 | #223 | Tragic 1.3% |
| Latvians | 7.1 /100 | #224 | Tragic 1.3% |
| Panamanians | 7.1 /100 | #225 | Tragic 1.3% |
| Bahamians | 7.1 /100 | #226 | Tragic 1.3% |
| Taiwanese | 6.1 /100 | #227 | Tragic 1.3% |
| Luxembourgers | 6.1 /100 | #228 | Tragic 1.3% |
| Immigrants | Costa Rica | 5.5 /100 | #229 | Tragic 1.3% |
| Lebanese | 5.3 /100 | #230 | Tragic 1.3% |
| Immigrants | Northern Europe | 4.7 /100 | #231 | Tragic 1.3% |
| French American Indians | 4.5 /100 | #232 | Tragic 1.3% |
| Tongans | 4.2 /100 | #233 | Tragic 1.3% |
| Pueblo | 3.8 /100 | #234 | Tragic 1.3% |
| Central American Indians | 3.6 /100 | #235 | Tragic 1.3% |