Blackfeet vs Immigrants from Morocco Disability Age Under 5
COMPARE
Blackfeet
Immigrants from Morocco
Disability Age Under 5
Disability Age Under 5 Comparison
Blackfeet
Immigrants from Morocco
1.6%
DISABILITY AGE UNDER 5
0.0/ 100
METRIC RATING
305th/ 347
METRIC RANK
1.2%
DISABILITY AGE UNDER 5
96.0/ 100
METRIC RATING
102nd/ 347
METRIC RANK
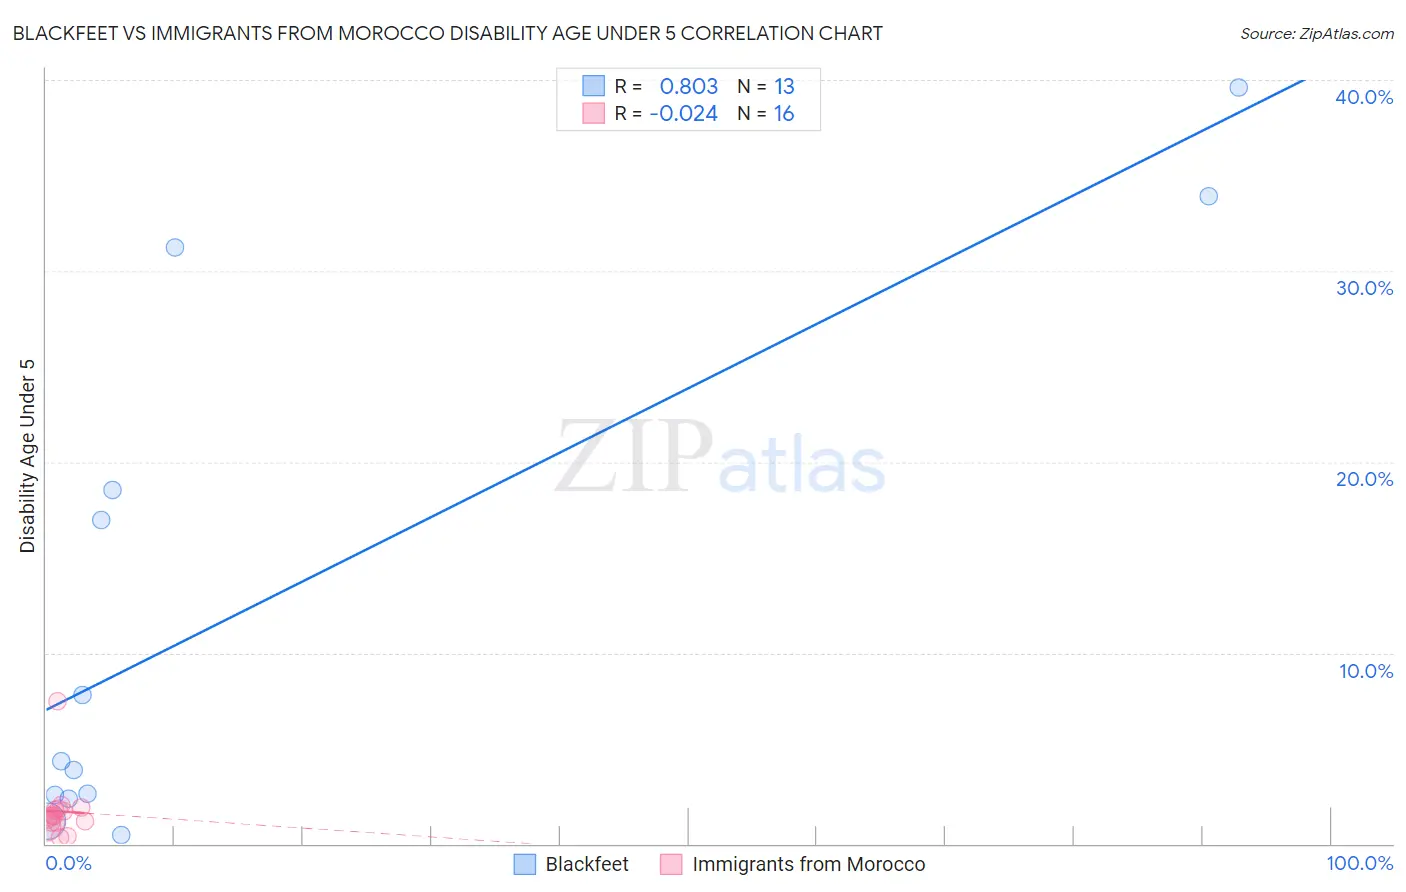
Blackfeet vs Immigrants from Morocco Disability Age Under 5 Correlation Chart
The statistical analysis conducted on geographies consisting of 184,518,312 people shows a very strong positive correlation between the proportion of Blackfeet and percentage of population with a disability under the age of 5 in the United States with a correlation coefficient (R) of 0.803 and weighted average of 1.6%. Similarly, the statistical analysis conducted on geographies consisting of 120,271,602 people shows no correlation between the proportion of Immigrants from Morocco and percentage of population with a disability under the age of 5 in the United States with a correlation coefficient (R) of -0.024 and weighted average of 1.2%, a difference of 43.0%.
Disability Age Under 5 Correlation Summary
| Measurement | Blackfeet | Immigrants from Morocco |
| Minimum | 0.46% | 0.32% |
| Maximum | 39.6% | 7.4% |
| Range | 39.1% | 7.1% |
| Mean | 12.7% | 1.7% |
| Median | 4.4% | 1.4% |
| Interquartile 25% (IQ1) | 2.4% | 1.1% |
| Interquartile 75% (IQ3) | 24.9% | 1.8% |
| Interquartile Range (IQR) | 22.5% | 0.68% |
| Standard Deviation (Sample) | 14.0% | 1.6% |
| Standard Deviation (Population) | 13.4% | 1.6% |
Similar Demographics by Disability Age Under 5
Demographics Similar to Blackfeet by Disability Age Under 5
In terms of disability age under 5, the demographic groups most similar to Blackfeet are Creek (1.6%, a difference of 0.040%), Scottish (1.6%, a difference of 0.10%), Seminole (1.6%, a difference of 0.16%), Navajo (1.6%, a difference of 0.25%), and Swiss (1.6%, a difference of 0.79%).
| Demographics | Rating | Rank | Disability Age Under 5 |
| Cajuns | 0.0 /100 | #298 | Tragic 1.6% |
| Portuguese | 0.0 /100 | #299 | Tragic 1.6% |
| Shoshone | 0.0 /100 | #300 | Tragic 1.6% |
| German Russians | 0.0 /100 | #301 | Tragic 1.6% |
| Welsh | 0.0 /100 | #302 | Tragic 1.6% |
| Swiss | 0.0 /100 | #303 | Tragic 1.6% |
| Seminole | 0.0 /100 | #304 | Tragic 1.6% |
| Blackfeet | 0.0 /100 | #305 | Tragic 1.6% |
| Creek | 0.0 /100 | #306 | Tragic 1.6% |
| Scottish | 0.0 /100 | #307 | Tragic 1.6% |
| Navajo | 0.0 /100 | #308 | Tragic 1.6% |
| Cape Verdeans | 0.0 /100 | #309 | Tragic 1.7% |
| Whites/Caucasians | 0.0 /100 | #310 | Tragic 1.7% |
| English | 0.0 /100 | #311 | Tragic 1.7% |
| Puerto Ricans | 0.0 /100 | #312 | Tragic 1.7% |
Demographics Similar to Immigrants from Morocco by Disability Age Under 5
In terms of disability age under 5, the demographic groups most similar to Immigrants from Morocco are Immigrants from Nicaragua (1.2%, a difference of 0.0%), Immigrants from Uganda (1.1%, a difference of 0.060%), Indonesian (1.2%, a difference of 0.070%), Nicaraguan (1.1%, a difference of 0.17%), and Dominican (1.1%, a difference of 0.20%).
| Demographics | Rating | Rank | Disability Age Under 5 |
| Immigrants | Moldova | 96.8 /100 | #95 | Exceptional 1.1% |
| Mongolians | 96.6 /100 | #96 | Exceptional 1.1% |
| Immigrants | Iraq | 96.5 /100 | #97 | Exceptional 1.1% |
| Immigrants | South Eastern Asia | 96.5 /100 | #98 | Exceptional 1.1% |
| Dominicans | 96.3 /100 | #99 | Exceptional 1.1% |
| Nicaraguans | 96.3 /100 | #100 | Exceptional 1.1% |
| Immigrants | Uganda | 96.1 /100 | #101 | Exceptional 1.1% |
| Immigrants | Morocco | 96.0 /100 | #102 | Exceptional 1.2% |
| Immigrants | Nicaragua | 96.0 /100 | #103 | Exceptional 1.2% |
| Indonesians | 95.9 /100 | #104 | Exceptional 1.2% |
| Immigrants | South Africa | 95.6 /100 | #105 | Exceptional 1.2% |
| Cambodians | 95.4 /100 | #106 | Exceptional 1.2% |
| Immigrants | West Indies | 95.3 /100 | #107 | Exceptional 1.2% |
| Iraqis | 95.1 /100 | #108 | Exceptional 1.2% |
| Immigrants | Panama | 95.0 /100 | #109 | Exceptional 1.2% |