Peruvian vs Chippewa Disability Age Under 5
COMPARE
Peruvian
Chippewa
Disability Age Under 5
Disability Age Under 5 Comparison
Peruvians
Chippewa
1.3%
DISABILITY AGE UNDER 5
37.6/ 100
METRIC RATING
189th/ 347
METRIC RANK
1.9%
DISABILITY AGE UNDER 5
0.0/ 100
METRIC RATING
332nd/ 347
METRIC RANK
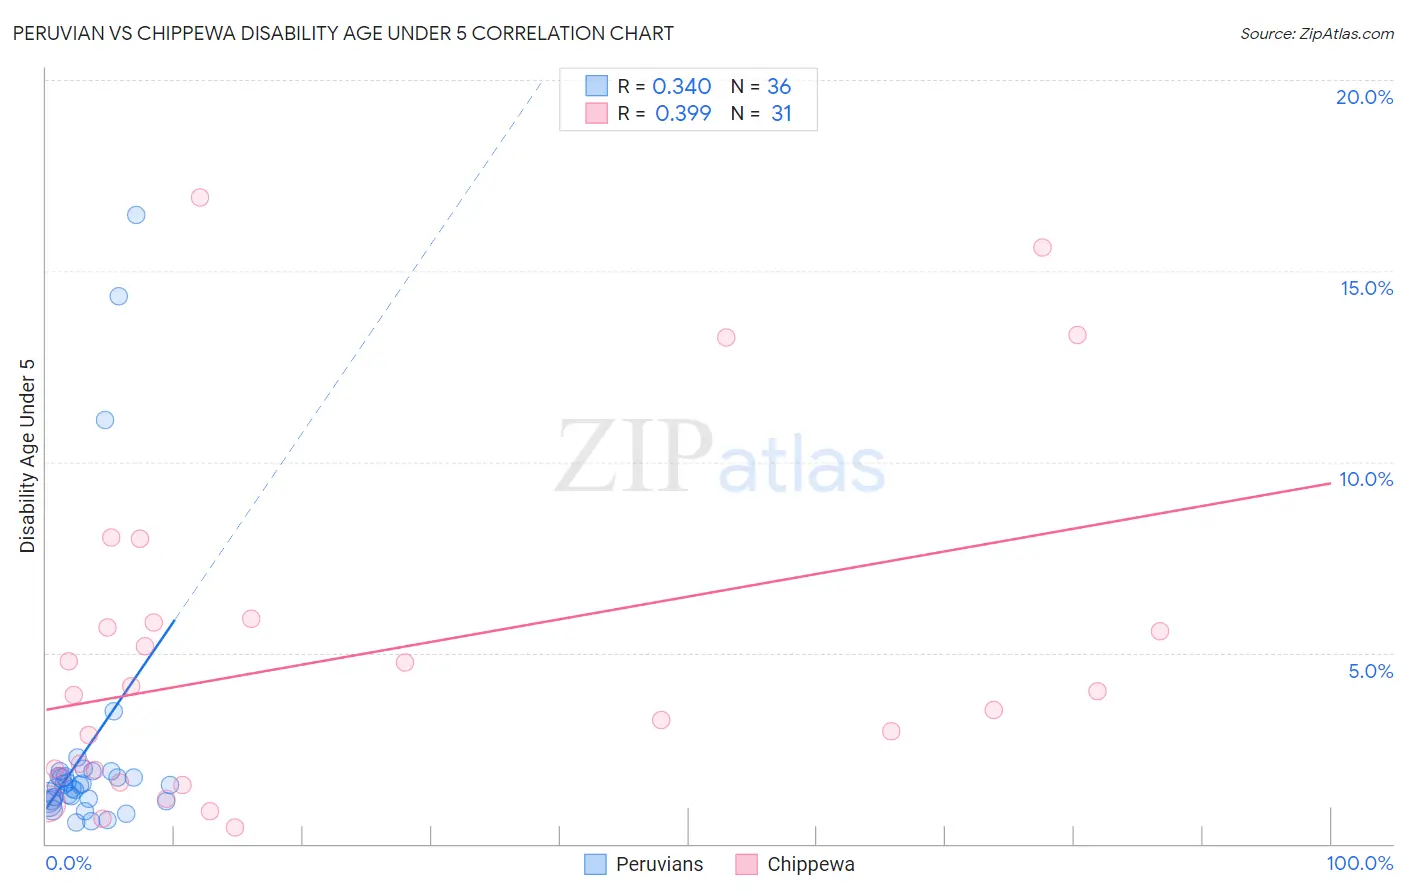
Peruvian vs Chippewa Disability Age Under 5 Correlation Chart
The statistical analysis conducted on geographies consisting of 205,658,783 people shows a mild positive correlation between the proportion of Peruvians and percentage of population with a disability under the age of 5 in the United States with a correlation coefficient (R) of 0.340 and weighted average of 1.3%. Similarly, the statistical analysis conducted on geographies consisting of 140,016,256 people shows a mild positive correlation between the proportion of Chippewa and percentage of population with a disability under the age of 5 in the United States with a correlation coefficient (R) of 0.399 and weighted average of 1.9%, a difference of 49.9%.
Disability Age Under 5 Correlation Summary
| Measurement | Peruvian | Chippewa |
| Minimum | 0.55% | 0.43% |
| Maximum | 16.5% | 16.9% |
| Range | 15.9% | 16.5% |
| Mean | 2.5% | 4.9% |
| Median | 1.6% | 3.9% |
| Interquartile 25% (IQ1) | 1.2% | 1.8% |
| Interquartile 75% (IQ3) | 1.8% | 5.8% |
| Interquartile Range (IQR) | 0.66% | 4.0% |
| Standard Deviation (Sample) | 3.6% | 4.4% |
| Standard Deviation (Population) | 3.6% | 4.3% |
Similar Demographics by Disability Age Under 5
Demographics Similar to Peruvians by Disability Age Under 5
In terms of disability age under 5, the demographic groups most similar to Peruvians are Immigrants from Laos (1.3%, a difference of 0.090%), Mexican American Indian (1.3%, a difference of 0.10%), Immigrants from Bosnia and Herzegovina (1.3%, a difference of 0.10%), Immigrants from Sierra Leone (1.3%, a difference of 0.11%), and Haitian (1.3%, a difference of 0.22%).
| Demographics | Rating | Rank | Disability Age Under 5 |
| Immigrants | Saudi Arabia | 43.3 /100 | #183 | Average 1.2% |
| Palestinians | 43.0 /100 | #184 | Average 1.2% |
| Immigrants | Western Africa | 42.5 /100 | #185 | Average 1.2% |
| Cubans | 42.5 /100 | #186 | Average 1.2% |
| Immigrants | Haiti | 40.2 /100 | #187 | Average 1.3% |
| Haitians | 39.9 /100 | #188 | Fair 1.3% |
| Peruvians | 37.6 /100 | #189 | Fair 1.3% |
| Immigrants | Laos | 36.6 /100 | #190 | Fair 1.3% |
| Mexican American Indians | 36.6 /100 | #191 | Fair 1.3% |
| Immigrants | Bosnia and Herzegovina | 36.5 /100 | #192 | Fair 1.3% |
| Immigrants | Sierra Leone | 36.5 /100 | #193 | Fair 1.3% |
| Immigrants | North Macedonia | 34.7 /100 | #194 | Fair 1.3% |
| U.S. Virgin Islanders | 34.4 /100 | #195 | Fair 1.3% |
| Immigrants | Belgium | 31.4 /100 | #196 | Fair 1.3% |
Demographics Similar to Chippewa by Disability Age Under 5
In terms of disability age under 5, the demographic groups most similar to Chippewa are French Canadian (1.9%, a difference of 0.060%), Choctaw (1.9%, a difference of 0.36%), Houma (1.9%, a difference of 0.69%), American (1.9%, a difference of 1.2%), and Osage (1.8%, a difference of 2.9%).
| Demographics | Rating | Rank | Disability Age Under 5 |
| Immigrants | Portugal | 0.0 /100 | #325 | Tragic 1.8% |
| Sioux | 0.0 /100 | #326 | Tragic 1.8% |
| Osage | 0.0 /100 | #327 | Tragic 1.8% |
| Americans | 0.0 /100 | #328 | Tragic 1.9% |
| Houma | 0.0 /100 | #329 | Tragic 1.9% |
| Choctaw | 0.0 /100 | #330 | Tragic 1.9% |
| French Canadians | 0.0 /100 | #331 | Tragic 1.9% |
| Chippewa | 0.0 /100 | #332 | Tragic 1.9% |
| Dutch West Indians | 0.0 /100 | #333 | Tragic 1.9% |
| Natives/Alaskans | 0.0 /100 | #334 | Tragic 1.9% |
| Pennsylvania Germans | 0.0 /100 | #335 | Tragic 1.9% |
| Paraguayans | 0.0 /100 | #336 | Tragic 2.0% |
| Apache | 0.0 /100 | #337 | Tragic 2.0% |
| Tohono O'odham | 0.0 /100 | #338 | Tragic 2.2% |
| Immigrants | Azores | 0.0 /100 | #339 | Tragic 2.2% |