Blackfeet vs Belizean Disability Age Under 5
COMPARE
Blackfeet
Belizean
Disability Age Under 5
Disability Age Under 5 Comparison
Blackfeet
Belizeans
1.6%
DISABILITY AGE UNDER 5
0.0/ 100
METRIC RATING
305th/ 347
METRIC RANK
1.2%
DISABILITY AGE UNDER 5
93.9/ 100
METRIC RATING
114th/ 347
METRIC RANK
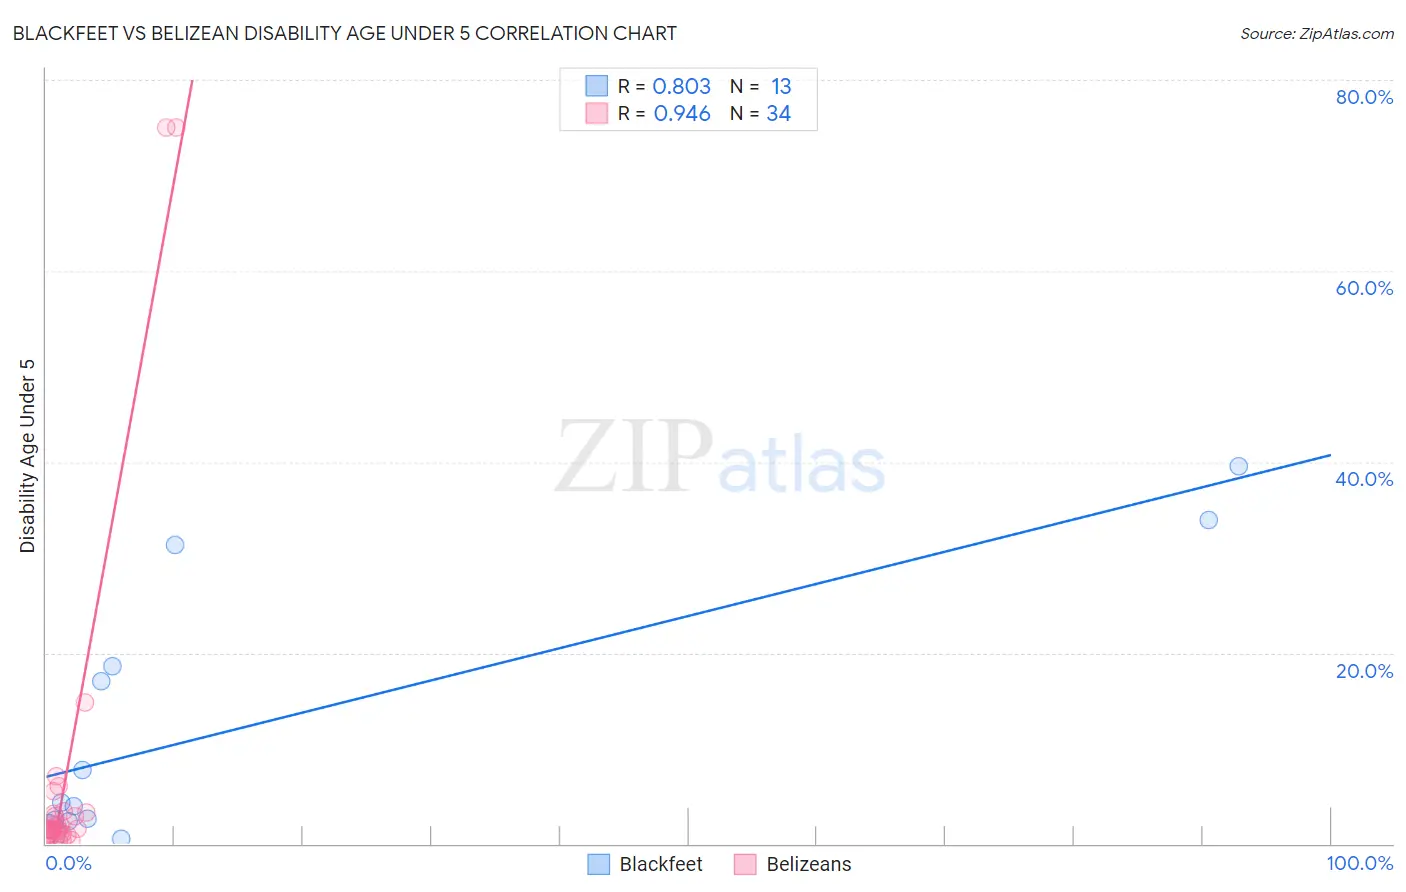
Blackfeet vs Belizean Disability Age Under 5 Correlation Chart
The statistical analysis conducted on geographies consisting of 184,518,312 people shows a very strong positive correlation between the proportion of Blackfeet and percentage of population with a disability under the age of 5 in the United States with a correlation coefficient (R) of 0.803 and weighted average of 1.6%. Similarly, the statistical analysis conducted on geographies consisting of 106,629,681 people shows a near-perfect positive correlation between the proportion of Belizeans and percentage of population with a disability under the age of 5 in the United States with a correlation coefficient (R) of 0.946 and weighted average of 1.2%, a difference of 41.4%.
Disability Age Under 5 Correlation Summary
| Measurement | Blackfeet | Belizean |
| Minimum | 0.46% | 0.27% |
| Maximum | 39.6% | 75.0% |
| Range | 39.1% | 74.7% |
| Mean | 12.7% | 6.7% |
| Median | 4.4% | 1.5% |
| Interquartile 25% (IQ1) | 2.4% | 1.0% |
| Interquartile 75% (IQ3) | 24.9% | 3.1% |
| Interquartile Range (IQR) | 22.5% | 2.1% |
| Standard Deviation (Sample) | 14.0% | 17.5% |
| Standard Deviation (Population) | 13.4% | 17.3% |
Similar Demographics by Disability Age Under 5
Demographics Similar to Blackfeet by Disability Age Under 5
In terms of disability age under 5, the demographic groups most similar to Blackfeet are Creek (1.6%, a difference of 0.040%), Scottish (1.6%, a difference of 0.10%), Seminole (1.6%, a difference of 0.16%), Navajo (1.6%, a difference of 0.25%), and Swiss (1.6%, a difference of 0.79%).
| Demographics | Rating | Rank | Disability Age Under 5 |
| Cajuns | 0.0 /100 | #298 | Tragic 1.6% |
| Portuguese | 0.0 /100 | #299 | Tragic 1.6% |
| Shoshone | 0.0 /100 | #300 | Tragic 1.6% |
| German Russians | 0.0 /100 | #301 | Tragic 1.6% |
| Welsh | 0.0 /100 | #302 | Tragic 1.6% |
| Swiss | 0.0 /100 | #303 | Tragic 1.6% |
| Seminole | 0.0 /100 | #304 | Tragic 1.6% |
| Blackfeet | 0.0 /100 | #305 | Tragic 1.6% |
| Creek | 0.0 /100 | #306 | Tragic 1.6% |
| Scottish | 0.0 /100 | #307 | Tragic 1.6% |
| Navajo | 0.0 /100 | #308 | Tragic 1.6% |
| Cape Verdeans | 0.0 /100 | #309 | Tragic 1.7% |
| Whites/Caucasians | 0.0 /100 | #310 | Tragic 1.7% |
| English | 0.0 /100 | #311 | Tragic 1.7% |
| Puerto Ricans | 0.0 /100 | #312 | Tragic 1.7% |
Demographics Similar to Belizeans by Disability Age Under 5
In terms of disability age under 5, the demographic groups most similar to Belizeans are Immigrants from Caribbean (1.2%, a difference of 0.010%), Immigrants from Northern Africa (1.2%, a difference of 0.030%), Immigrants from Oceania (1.2%, a difference of 0.15%), Immigrants from Philippines (1.2%, a difference of 0.17%), and Immigrants from Venezuela (1.2%, a difference of 0.20%).
| Demographics | Rating | Rank | Disability Age Under 5 |
| Immigrants | West Indies | 95.3 /100 | #107 | Exceptional 1.2% |
| Iraqis | 95.1 /100 | #108 | Exceptional 1.2% |
| Immigrants | Panama | 95.0 /100 | #109 | Exceptional 1.2% |
| Immigrants | Lebanon | 95.0 /100 | #110 | Exceptional 1.2% |
| Senegalese | 94.6 /100 | #111 | Exceptional 1.2% |
| Immigrants | Australia | 94.4 /100 | #112 | Exceptional 1.2% |
| Immigrants | Oceania | 94.2 /100 | #113 | Exceptional 1.2% |
| Belizeans | 93.9 /100 | #114 | Exceptional 1.2% |
| Immigrants | Caribbean | 93.8 /100 | #115 | Exceptional 1.2% |
| Immigrants | Northern Africa | 93.8 /100 | #116 | Exceptional 1.2% |
| Immigrants | Philippines | 93.5 /100 | #117 | Exceptional 1.2% |
| Immigrants | Venezuela | 93.4 /100 | #118 | Exceptional 1.2% |
| Bhutanese | 92.5 /100 | #119 | Exceptional 1.2% |
| Immigrants | Eritrea | 92.3 /100 | #120 | Exceptional 1.2% |
| Immigrants | Senegal | 91.4 /100 | #121 | Exceptional 1.2% |