Blackfeet vs Chippewa In Labor Force | Age 25-29
COMPARE
Blackfeet
Chippewa
In Labor Force | Age 25-29
In Labor Force | Age 25-29 Comparison
Blackfeet
Chippewa
82.6%
IN LABOR FORCE | AGE 25-29
0.0/ 100
METRIC RATING
306th/ 347
METRIC RANK
82.9%
IN LABOR FORCE | AGE 25-29
0.0/ 100
METRIC RATING
295th/ 347
METRIC RANK
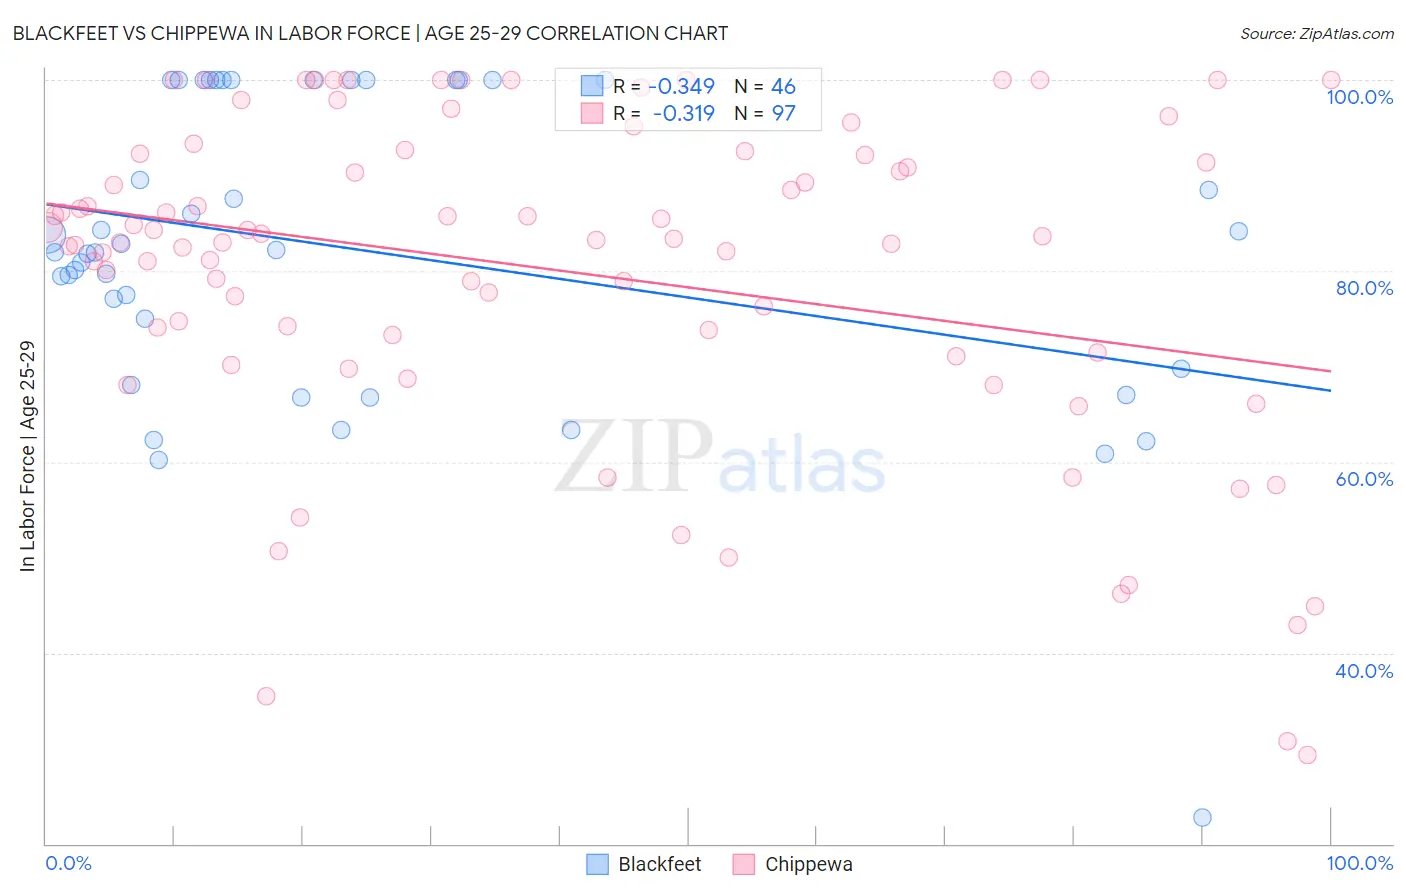
Blackfeet vs Chippewa In Labor Force | Age 25-29 Correlation Chart
The statistical analysis conducted on geographies consisting of 309,474,956 people shows a mild negative correlation between the proportion of Blackfeet and labor force participation rate among population between the ages 25 and 29 in the United States with a correlation coefficient (R) of -0.349 and weighted average of 82.6%. Similarly, the statistical analysis conducted on geographies consisting of 215,004,507 people shows a mild negative correlation between the proportion of Chippewa and labor force participation rate among population between the ages 25 and 29 in the United States with a correlation coefficient (R) of -0.319 and weighted average of 82.9%, a difference of 0.40%.
In Labor Force | Age 25-29 Correlation Summary
| Measurement | Blackfeet | Chippewa |
| Minimum | 22.7% | 29.3% |
| Maximum | 100.0% | 100.0% |
| Range | 77.3% | 70.7% |
| Mean | 82.1% | 80.2% |
| Median | 82.1% | 83.3% |
| Interquartile 25% (IQ1) | 69.8% | 72.3% |
| Interquartile 75% (IQ3) | 100.0% | 92.4% |
| Interquartile Range (IQR) | 30.2% | 20.1% |
| Standard Deviation (Sample) | 16.2% | 17.1% |
| Standard Deviation (Population) | 16.0% | 17.0% |
Demographics Similar to Blackfeet and Chippewa by In Labor Force | Age 25-29
In terms of in labor force | age 25-29, the demographic groups most similar to Blackfeet are Black/African American (82.6%, a difference of 0.010%), Cajun (82.5%, a difference of 0.060%), Immigrants from St. Vincent and the Grenadines (82.7%, a difference of 0.13%), Central American Indian (82.4%, a difference of 0.21%), and Immigrants from Central America (82.4%, a difference of 0.22%). Similarly, the demographic groups most similar to Chippewa are Nepalese (82.9%, a difference of 0.0%), Immigrants from Nicaragua (82.9%, a difference of 0.0%), Potawatomi (82.9%, a difference of 0.0%), Immigrants from Latin America (82.9%, a difference of 0.010%), and Native Hawaiian (82.9%, a difference of 0.020%).
| Demographics | Rating | Rank | In Labor Force | Age 25-29 |
| Immigrants | Bangladesh | 0.0 /100 | #290 | Tragic 83.0% |
| Hawaiians | 0.0 /100 | #291 | Tragic 83.0% |
| Immigrants | Guyana | 0.0 /100 | #292 | Tragic 83.0% |
| Immigrants | Latin America | 0.0 /100 | #293 | Tragic 82.9% |
| Nepalese | 0.0 /100 | #294 | Tragic 82.9% |
| Chippewa | 0.0 /100 | #295 | Tragic 82.9% |
| Immigrants | Nicaragua | 0.0 /100 | #296 | Tragic 82.9% |
| Potawatomi | 0.0 /100 | #297 | Tragic 82.9% |
| Native Hawaiians | 0.0 /100 | #298 | Tragic 82.9% |
| Fijians | 0.0 /100 | #299 | Tragic 82.9% |
| Spanish American Indians | 0.0 /100 | #300 | Tragic 82.9% |
| Vietnamese | 0.0 /100 | #301 | Tragic 82.8% |
| Immigrants | Belize | 0.0 /100 | #302 | Tragic 82.8% |
| Immigrants | Grenada | 0.0 /100 | #303 | Tragic 82.8% |
| Immigrants | St. Vincent and the Grenadines | 0.0 /100 | #304 | Tragic 82.7% |
| Blacks/African Americans | 0.0 /100 | #305 | Tragic 82.6% |
| Blackfeet | 0.0 /100 | #306 | Tragic 82.6% |
| Cajuns | 0.0 /100 | #307 | Tragic 82.5% |
| Central American Indians | 0.0 /100 | #308 | Tragic 82.4% |
| Immigrants | Central America | 0.0 /100 | #309 | Tragic 82.4% |
| Osage | 0.0 /100 | #310 | Tragic 82.3% |