Immigrants from Italy vs Chippewa Disability Age Under 5
COMPARE
Immigrants from Italy
Chippewa
Disability Age Under 5
Disability Age Under 5 Comparison
Immigrants from Italy
Chippewa
1.3%
DISABILITY AGE UNDER 5
25.4/ 100
METRIC RATING
201st/ 347
METRIC RANK
1.9%
DISABILITY AGE UNDER 5
0.0/ 100
METRIC RATING
332nd/ 347
METRIC RANK
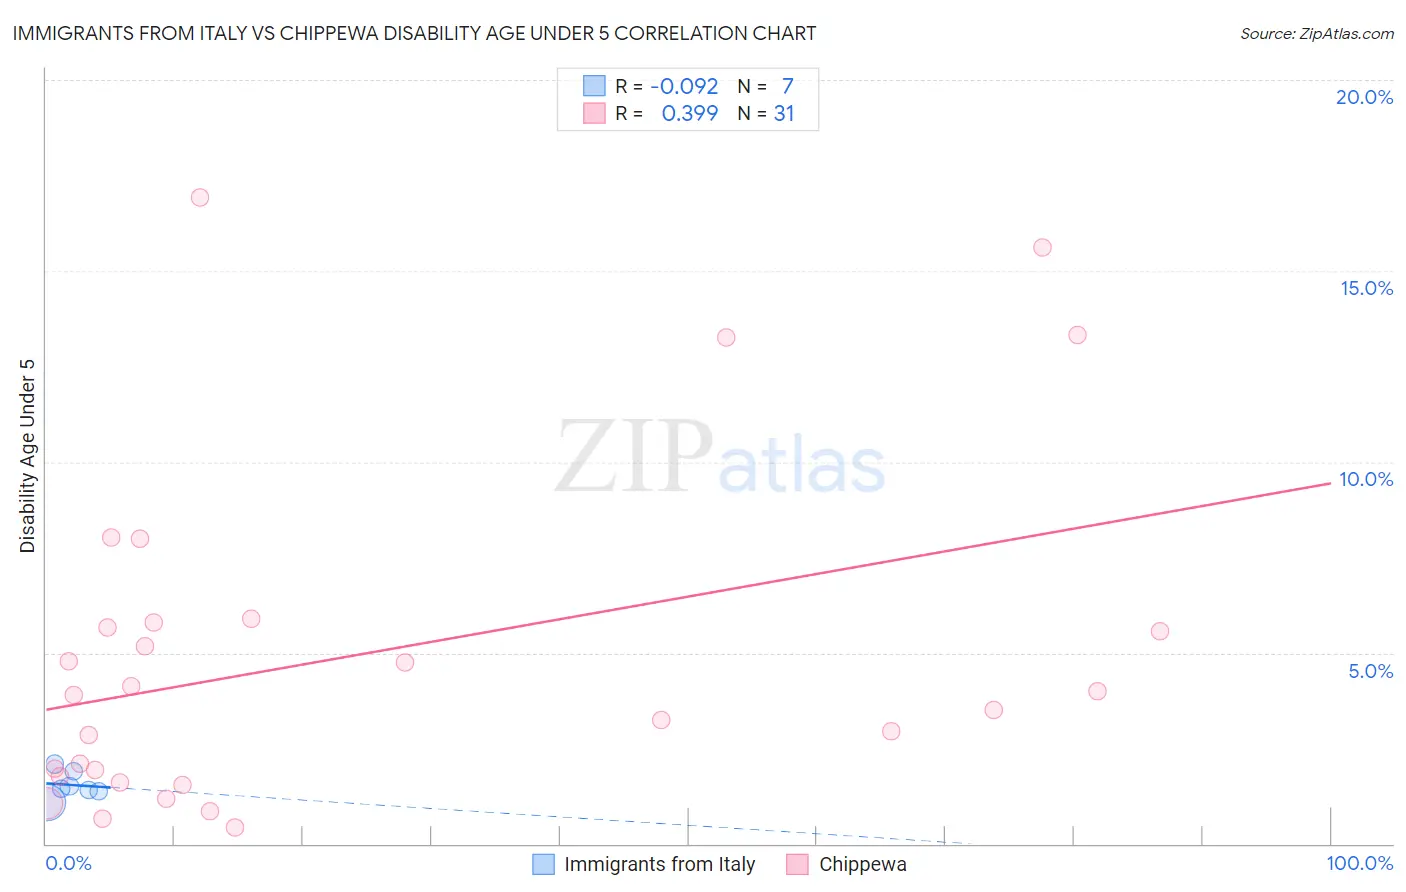
Immigrants from Italy vs Chippewa Disability Age Under 5 Correlation Chart
The statistical analysis conducted on geographies consisting of 181,565,904 people shows a slight negative correlation between the proportion of Immigrants from Italy and percentage of population with a disability under the age of 5 in the United States with a correlation coefficient (R) of -0.092 and weighted average of 1.3%. Similarly, the statistical analysis conducted on geographies consisting of 140,016,256 people shows a mild positive correlation between the proportion of Chippewa and percentage of population with a disability under the age of 5 in the United States with a correlation coefficient (R) of 0.399 and weighted average of 1.9%, a difference of 48.0%.
Disability Age Under 5 Correlation Summary
| Measurement | Immigrants from Italy | Chippewa |
| Minimum | 1.1% | 0.43% |
| Maximum | 2.1% | 16.9% |
| Range | 1.0% | 16.5% |
| Mean | 1.5% | 4.9% |
| Median | 1.4% | 3.9% |
| Interquartile 25% (IQ1) | 1.4% | 1.8% |
| Interquartile 75% (IQ3) | 1.9% | 5.8% |
| Interquartile Range (IQR) | 0.54% | 4.0% |
| Standard Deviation (Sample) | 0.34% | 4.4% |
| Standard Deviation (Population) | 0.32% | 4.3% |
Similar Demographics by Disability Age Under 5
Demographics Similar to Immigrants from Italy by Disability Age Under 5
In terms of disability age under 5, the demographic groups most similar to Immigrants from Italy are Arapaho (1.3%, a difference of 0.15%), Liberian (1.3%, a difference of 0.16%), Immigrants from Lithuania (1.3%, a difference of 0.20%), Immigrants from Europe (1.3%, a difference of 0.21%), and Romanian (1.3%, a difference of 0.34%).
| Demographics | Rating | Rank | Disability Age Under 5 |
| Immigrants | North Macedonia | 34.7 /100 | #194 | Fair 1.3% |
| U.S. Virgin Islanders | 34.4 /100 | #195 | Fair 1.3% |
| Immigrants | Belgium | 31.4 /100 | #196 | Fair 1.3% |
| Immigrants | Somalia | 31.3 /100 | #197 | Fair 1.3% |
| Immigrants | Norway | 31.1 /100 | #198 | Fair 1.3% |
| Jamaicans | 30.7 /100 | #199 | Fair 1.3% |
| Immigrants | Lithuania | 27.2 /100 | #200 | Fair 1.3% |
| Immigrants | Italy | 25.4 /100 | #201 | Fair 1.3% |
| Arapaho | 24.1 /100 | #202 | Fair 1.3% |
| Liberians | 24.0 /100 | #203 | Fair 1.3% |
| Immigrants | Europe | 23.6 /100 | #204 | Fair 1.3% |
| Romanians | 22.5 /100 | #205 | Fair 1.3% |
| Immigrants | Poland | 22.4 /100 | #206 | Fair 1.3% |
| Nigerians | 21.2 /100 | #207 | Fair 1.3% |
| Mexicans | 20.8 /100 | #208 | Fair 1.3% |
Demographics Similar to Chippewa by Disability Age Under 5
In terms of disability age under 5, the demographic groups most similar to Chippewa are French Canadian (1.9%, a difference of 0.060%), Choctaw (1.9%, a difference of 0.36%), Houma (1.9%, a difference of 0.69%), American (1.9%, a difference of 1.2%), and Osage (1.8%, a difference of 2.9%).
| Demographics | Rating | Rank | Disability Age Under 5 |
| Immigrants | Portugal | 0.0 /100 | #325 | Tragic 1.8% |
| Sioux | 0.0 /100 | #326 | Tragic 1.8% |
| Osage | 0.0 /100 | #327 | Tragic 1.8% |
| Americans | 0.0 /100 | #328 | Tragic 1.9% |
| Houma | 0.0 /100 | #329 | Tragic 1.9% |
| Choctaw | 0.0 /100 | #330 | Tragic 1.9% |
| French Canadians | 0.0 /100 | #331 | Tragic 1.9% |
| Chippewa | 0.0 /100 | #332 | Tragic 1.9% |
| Dutch West Indians | 0.0 /100 | #333 | Tragic 1.9% |
| Natives/Alaskans | 0.0 /100 | #334 | Tragic 1.9% |
| Pennsylvania Germans | 0.0 /100 | #335 | Tragic 1.9% |
| Paraguayans | 0.0 /100 | #336 | Tragic 2.0% |
| Apache | 0.0 /100 | #337 | Tragic 2.0% |
| Tohono O'odham | 0.0 /100 | #338 | Tragic 2.2% |
| Immigrants | Azores | 0.0 /100 | #339 | Tragic 2.2% |