Comanche vs Immigrants from Korea Vision Disability
COMPARE
Comanche
Immigrants from Korea
Vision Disability
Vision Disability Comparison
Comanche
Immigrants from Korea
2.8%
VISION DISABILITY
0.0/ 100
METRIC RATING
321st/ 347
METRIC RANK
1.8%
VISION DISABILITY
100.0/ 100
METRIC RATING
12th/ 347
METRIC RANK
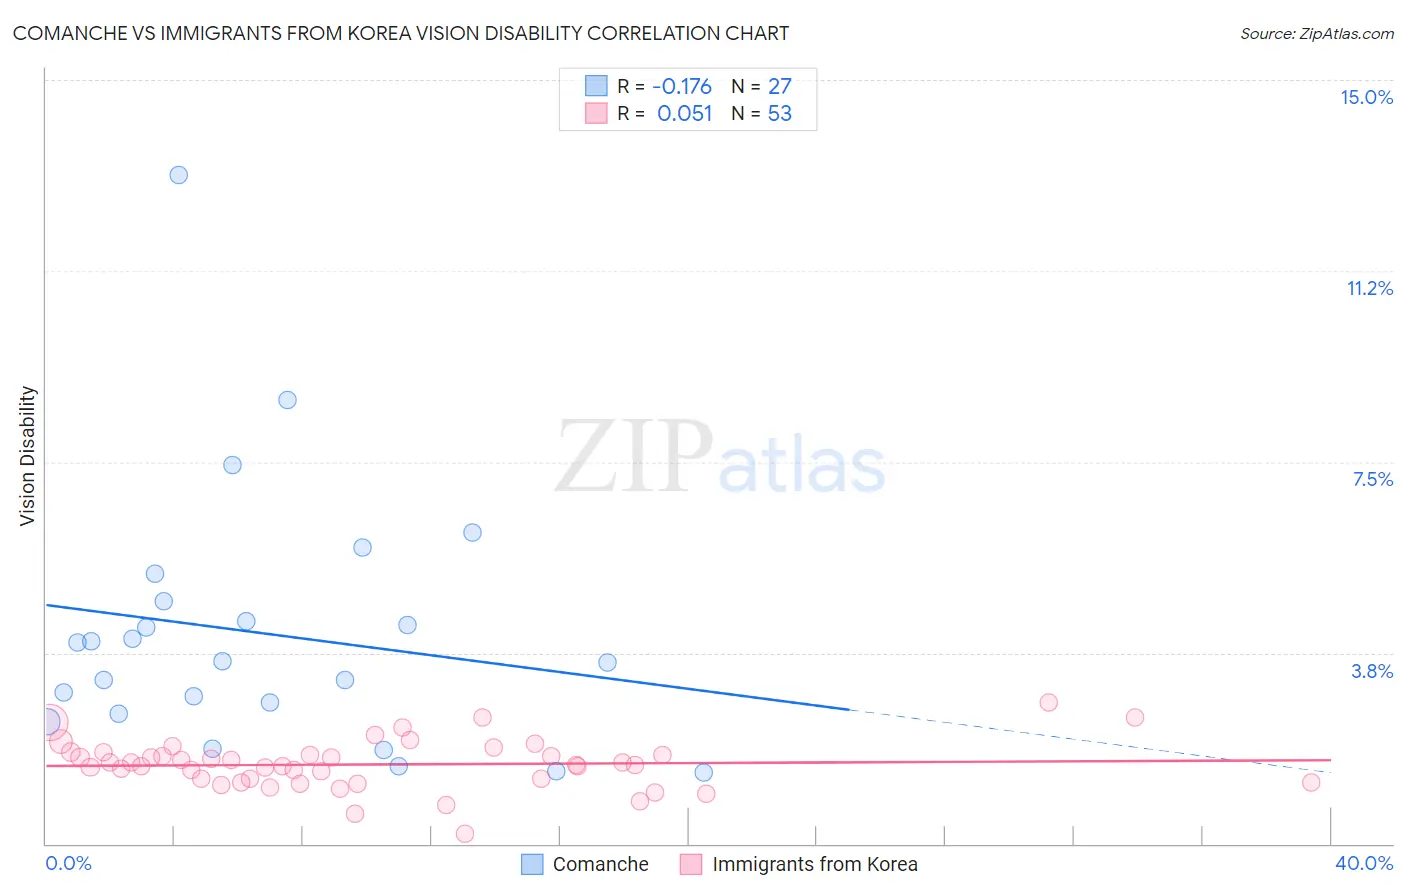
Comanche vs Immigrants from Korea Vision Disability Correlation Chart
The statistical analysis conducted on geographies consisting of 109,767,498 people shows a poor negative correlation between the proportion of Comanche and percentage of population with vision disability in the United States with a correlation coefficient (R) of -0.176 and weighted average of 2.8%. Similarly, the statistical analysis conducted on geographies consisting of 415,890,370 people shows a slight positive correlation between the proportion of Immigrants from Korea and percentage of population with vision disability in the United States with a correlation coefficient (R) of 0.051 and weighted average of 1.8%, a difference of 55.4%.
Vision Disability Correlation Summary
| Measurement | Comanche | Immigrants from Korea |
| Minimum | 1.4% | 0.21% |
| Maximum | 13.1% | 2.8% |
| Range | 11.8% | 2.6% |
| Mean | 4.1% | 1.6% |
| Median | 3.6% | 1.5% |
| Interquartile 25% (IQ1) | 2.6% | 1.2% |
| Interquartile 75% (IQ3) | 4.8% | 1.8% |
| Interquartile Range (IQR) | 2.2% | 0.53% |
| Standard Deviation (Sample) | 2.5% | 0.48% |
| Standard Deviation (Population) | 2.5% | 0.47% |
Similar Demographics by Vision Disability
Demographics Similar to Comanche by Vision Disability
In terms of vision disability, the demographic groups most similar to Comanche are Paiute (2.9%, a difference of 0.42%), Tlingit-Haida (2.9%, a difference of 0.42%), Black/African American (2.8%, a difference of 2.0%), Hopi (2.9%, a difference of 2.4%), and Cherokee (2.9%, a difference of 2.4%).
| Demographics | Rating | Rank | Vision Disability |
| Inupiat | 0.0 /100 | #314 | Tragic 2.7% |
| Osage | 0.0 /100 | #315 | Tragic 2.7% |
| Shoshone | 0.0 /100 | #316 | Tragic 2.7% |
| Yup'ik | 0.0 /100 | #317 | Tragic 2.7% |
| Alaska Natives | 0.0 /100 | #318 | Tragic 2.7% |
| Tohono O'odham | 0.0 /100 | #319 | Tragic 2.8% |
| Blacks/African Americans | 0.0 /100 | #320 | Tragic 2.8% |
| Comanche | 0.0 /100 | #321 | Tragic 2.8% |
| Paiute | 0.0 /100 | #322 | Tragic 2.9% |
| Tlingit-Haida | 0.0 /100 | #323 | Tragic 2.9% |
| Hopi | 0.0 /100 | #324 | Tragic 2.9% |
| Cherokee | 0.0 /100 | #325 | Tragic 2.9% |
| Spanish Americans | 0.0 /100 | #326 | Tragic 2.9% |
| Natives/Alaskans | 0.0 /100 | #327 | Tragic 3.0% |
| Yuman | 0.0 /100 | #328 | Tragic 3.0% |
Demographics Similar to Immigrants from Korea by Vision Disability
In terms of vision disability, the demographic groups most similar to Immigrants from Korea are Immigrants from Eastern Asia (1.8%, a difference of 0.080%), Immigrants from China (1.8%, a difference of 0.22%), Immigrants from Israel (1.8%, a difference of 0.23%), Immigrants from Bolivia (1.8%, a difference of 0.65%), and Indian (Asian) (1.8%, a difference of 1.1%).
| Demographics | Rating | Rank | Vision Disability |
| Okinawans | 100.0 /100 | #5 | Exceptional 1.8% |
| Immigrants | Iran | 100.0 /100 | #6 | Exceptional 1.8% |
| Immigrants | South Central Asia | 100.0 /100 | #7 | Exceptional 1.8% |
| Iranians | 100.0 /100 | #8 | Exceptional 1.8% |
| Immigrants | Singapore | 100.0 /100 | #9 | Exceptional 1.8% |
| Immigrants | Hong Kong | 100.0 /100 | #10 | Exceptional 1.8% |
| Immigrants | Israel | 100.0 /100 | #11 | Exceptional 1.8% |
| Immigrants | Korea | 100.0 /100 | #12 | Exceptional 1.8% |
| Immigrants | Eastern Asia | 100.0 /100 | #13 | Exceptional 1.8% |
| Immigrants | China | 100.0 /100 | #14 | Exceptional 1.8% |
| Immigrants | Bolivia | 100.0 /100 | #15 | Exceptional 1.8% |
| Indians (Asian) | 100.0 /100 | #16 | Exceptional 1.8% |
| Burmese | 100.0 /100 | #17 | Exceptional 1.8% |
| Bolivians | 100.0 /100 | #18 | Exceptional 1.9% |
| Immigrants | Sri Lanka | 100.0 /100 | #19 | Exceptional 1.9% |