Bhutanese vs Immigrants from Korea Per Capita Income
COMPARE
Bhutanese
Immigrants from Korea
Per Capita Income
Per Capita Income Comparison
Bhutanese
Immigrants from Korea
$49,894
PER CAPITA INCOME
99.9/ 100
METRIC RATING
59th/ 347
METRIC RANK
$51,671
PER CAPITA INCOME
100.0/ 100
METRIC RATING
40th/ 347
METRIC RANK
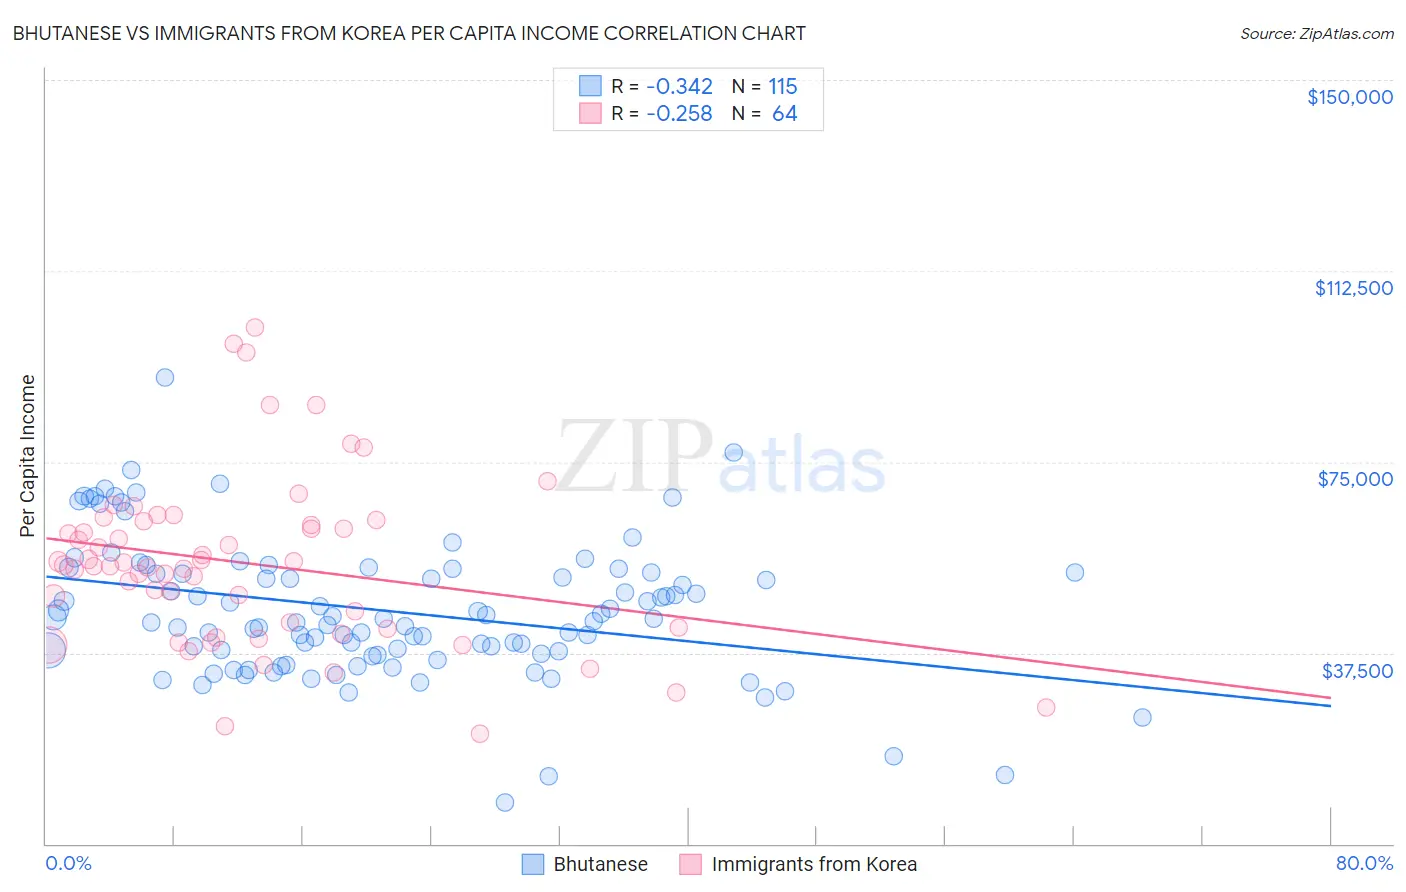
Bhutanese vs Immigrants from Korea Per Capita Income Correlation Chart
The statistical analysis conducted on geographies consisting of 455,599,247 people shows a mild negative correlation between the proportion of Bhutanese and per capita income in the United States with a correlation coefficient (R) of -0.342 and weighted average of $49,894. Similarly, the statistical analysis conducted on geographies consisting of 416,363,893 people shows a weak negative correlation between the proportion of Immigrants from Korea and per capita income in the United States with a correlation coefficient (R) of -0.258 and weighted average of $51,671, a difference of 3.6%.
Per Capita Income Correlation Summary
| Measurement | Bhutanese | Immigrants from Korea |
| Minimum | $8,097 | $21,671 |
| Maximum | $91,569 | $101,406 |
| Range | $83,472 | $79,735 |
| Mean | $45,753 | $55,080 |
| Median | $44,077 | $54,636 |
| Interquartile 25% (IQ1) | $37,217 | $42,367 |
| Interquartile 75% (IQ3) | $53,334 | $62,916 |
| Interquartile Range (IQR) | $16,117 | $20,549 |
| Standard Deviation (Sample) | $13,593 | $16,727 |
| Standard Deviation (Population) | $13,533 | $16,596 |
Demographics Similar to Bhutanese and Immigrants from Korea by Per Capita Income
In terms of per capita income, the demographic groups most similar to Bhutanese are Immigrants from Malaysia ($49,983, a difference of 0.18%), South African ($50,044, a difference of 0.30%), Asian ($50,057, a difference of 0.33%), Immigrants from Western Europe ($50,065, a difference of 0.34%), and Immigrants from Belarus ($50,303, a difference of 0.82%). Similarly, the demographic groups most similar to Immigrants from Korea are Cambodian ($51,731, a difference of 0.12%), Immigrants from South Africa ($51,465, a difference of 0.40%), Immigrants from Turkey ($51,368, a difference of 0.59%), Immigrants from Lithuania ($51,361, a difference of 0.60%), and Immigrants from Europe ($50,950, a difference of 1.4%).
| Demographics | Rating | Rank | Per Capita Income |
| Cambodians | 100.0 /100 | #39 | Exceptional $51,731 |
| Immigrants | Korea | 100.0 /100 | #40 | Exceptional $51,671 |
| Immigrants | South Africa | 100.0 /100 | #41 | Exceptional $51,465 |
| Immigrants | Turkey | 100.0 /100 | #42 | Exceptional $51,368 |
| Immigrants | Lithuania | 100.0 /100 | #43 | Exceptional $51,361 |
| Immigrants | Europe | 100.0 /100 | #44 | Exceptional $50,950 |
| Immigrants | Spain | 100.0 /100 | #45 | Exceptional $50,933 |
| Immigrants | Latvia | 100.0 /100 | #46 | Exceptional $50,914 |
| Bulgarians | 100.0 /100 | #47 | Exceptional $50,906 |
| Immigrants | Serbia | 100.0 /100 | #48 | Exceptional $50,810 |
| New Zealanders | 100.0 /100 | #49 | Exceptional $50,575 |
| Immigrants | Sri Lanka | 100.0 /100 | #50 | Exceptional $50,555 |
| Immigrants | Netherlands | 100.0 /100 | #51 | Exceptional $50,458 |
| Immigrants | Croatia | 99.9 /100 | #52 | Exceptional $50,417 |
| Paraguayans | 99.9 /100 | #53 | Exceptional $50,385 |
| Immigrants | Belarus | 99.9 /100 | #54 | Exceptional $50,303 |
| Immigrants | Western Europe | 99.9 /100 | #55 | Exceptional $50,065 |
| Asians | 99.9 /100 | #56 | Exceptional $50,057 |
| South Africans | 99.9 /100 | #57 | Exceptional $50,044 |
| Immigrants | Malaysia | 99.9 /100 | #58 | Exceptional $49,983 |
| Bhutanese | 99.9 /100 | #59 | Exceptional $49,894 |