French American Indian vs Immigrants from Korea Vision Disability
COMPARE
French American Indian
Immigrants from Korea
Vision Disability
Vision Disability Comparison
French American Indians
Immigrants from Korea
2.5%
VISION DISABILITY
0.0/ 100
METRIC RATING
288th/ 347
METRIC RANK
1.8%
VISION DISABILITY
100.0/ 100
METRIC RATING
12th/ 347
METRIC RANK
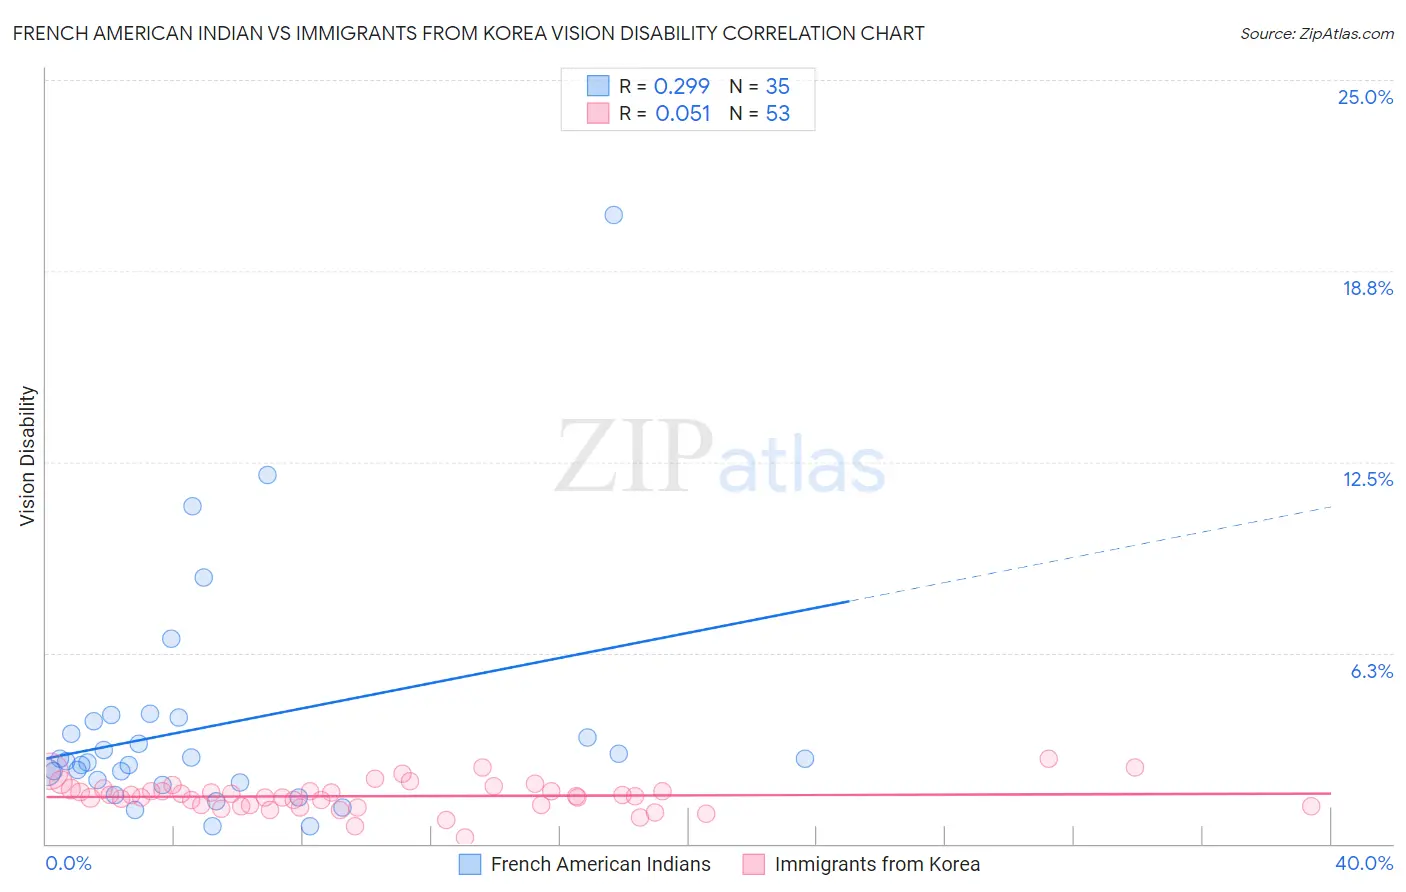
French American Indian vs Immigrants from Korea Vision Disability Correlation Chart
The statistical analysis conducted on geographies consisting of 131,938,190 people shows a weak positive correlation between the proportion of French American Indians and percentage of population with vision disability in the United States with a correlation coefficient (R) of 0.299 and weighted average of 2.5%. Similarly, the statistical analysis conducted on geographies consisting of 415,890,370 people shows a slight positive correlation between the proportion of Immigrants from Korea and percentage of population with vision disability in the United States with a correlation coefficient (R) of 0.051 and weighted average of 1.8%, a difference of 35.0%.
Vision Disability Correlation Summary
| Measurement | French American Indian | Immigrants from Korea |
| Minimum | 0.57% | 0.21% |
| Maximum | 20.6% | 2.8% |
| Range | 20.0% | 2.6% |
| Mean | 3.8% | 1.6% |
| Median | 2.7% | 1.5% |
| Interquartile 25% (IQ1) | 2.0% | 1.2% |
| Interquartile 75% (IQ3) | 4.0% | 1.8% |
| Interquartile Range (IQR) | 2.0% | 0.53% |
| Standard Deviation (Sample) | 3.9% | 0.48% |
| Standard Deviation (Population) | 3.8% | 0.47% |
Similar Demographics by Vision Disability
Demographics Similar to French American Indians by Vision Disability
In terms of vision disability, the demographic groups most similar to French American Indians are Honduran (2.5%, a difference of 0.020%), Sioux (2.5%, a difference of 0.17%), Immigrants from Central America (2.5%, a difference of 0.18%), Yakama (2.5%, a difference of 0.19%), and Nonimmigrants (2.5%, a difference of 0.41%).
| Demographics | Rating | Rank | Vision Disability |
| U.S. Virgin Islanders | 0.0 /100 | #281 | Tragic 2.5% |
| Immigrants | Caribbean | 0.0 /100 | #282 | Tragic 2.5% |
| Puget Sound Salish | 0.0 /100 | #283 | Tragic 2.5% |
| Yakama | 0.0 /100 | #284 | Tragic 2.5% |
| Immigrants | Central America | 0.0 /100 | #285 | Tragic 2.5% |
| Sioux | 0.0 /100 | #286 | Tragic 2.5% |
| Hondurans | 0.0 /100 | #287 | Tragic 2.5% |
| French American Indians | 0.0 /100 | #288 | Tragic 2.5% |
| Immigrants | Nonimmigrants | 0.0 /100 | #289 | Tragic 2.5% |
| Immigrants | Cuba | 0.0 /100 | #290 | Tragic 2.5% |
| Immigrants | Honduras | 0.0 /100 | #291 | Tragic 2.5% |
| Crow | 0.0 /100 | #292 | Tragic 2.5% |
| Yaqui | 0.0 /100 | #293 | Tragic 2.5% |
| Ottawa | 0.0 /100 | #294 | Tragic 2.5% |
| Delaware | 0.0 /100 | #295 | Tragic 2.5% |
Demographics Similar to Immigrants from Korea by Vision Disability
In terms of vision disability, the demographic groups most similar to Immigrants from Korea are Immigrants from Eastern Asia (1.8%, a difference of 0.080%), Immigrants from China (1.8%, a difference of 0.22%), Immigrants from Israel (1.8%, a difference of 0.23%), Immigrants from Bolivia (1.8%, a difference of 0.65%), and Indian (Asian) (1.8%, a difference of 1.1%).
| Demographics | Rating | Rank | Vision Disability |
| Okinawans | 100.0 /100 | #5 | Exceptional 1.8% |
| Immigrants | Iran | 100.0 /100 | #6 | Exceptional 1.8% |
| Immigrants | South Central Asia | 100.0 /100 | #7 | Exceptional 1.8% |
| Iranians | 100.0 /100 | #8 | Exceptional 1.8% |
| Immigrants | Singapore | 100.0 /100 | #9 | Exceptional 1.8% |
| Immigrants | Hong Kong | 100.0 /100 | #10 | Exceptional 1.8% |
| Immigrants | Israel | 100.0 /100 | #11 | Exceptional 1.8% |
| Immigrants | Korea | 100.0 /100 | #12 | Exceptional 1.8% |
| Immigrants | Eastern Asia | 100.0 /100 | #13 | Exceptional 1.8% |
| Immigrants | China | 100.0 /100 | #14 | Exceptional 1.8% |
| Immigrants | Bolivia | 100.0 /100 | #15 | Exceptional 1.8% |
| Indians (Asian) | 100.0 /100 | #16 | Exceptional 1.8% |
| Burmese | 100.0 /100 | #17 | Exceptional 1.8% |
| Bolivians | 100.0 /100 | #18 | Exceptional 1.9% |
| Immigrants | Sri Lanka | 100.0 /100 | #19 | Exceptional 1.9% |