Cheyenne vs Immigrants from Korea Vision Disability
COMPARE
Cheyenne
Immigrants from Korea
Vision Disability
Vision Disability Comparison
Cheyenne
Immigrants from Korea
3.1%
VISION DISABILITY
0.0/ 100
METRIC RATING
334th/ 347
METRIC RANK
1.8%
VISION DISABILITY
100.0/ 100
METRIC RATING
12th/ 347
METRIC RANK
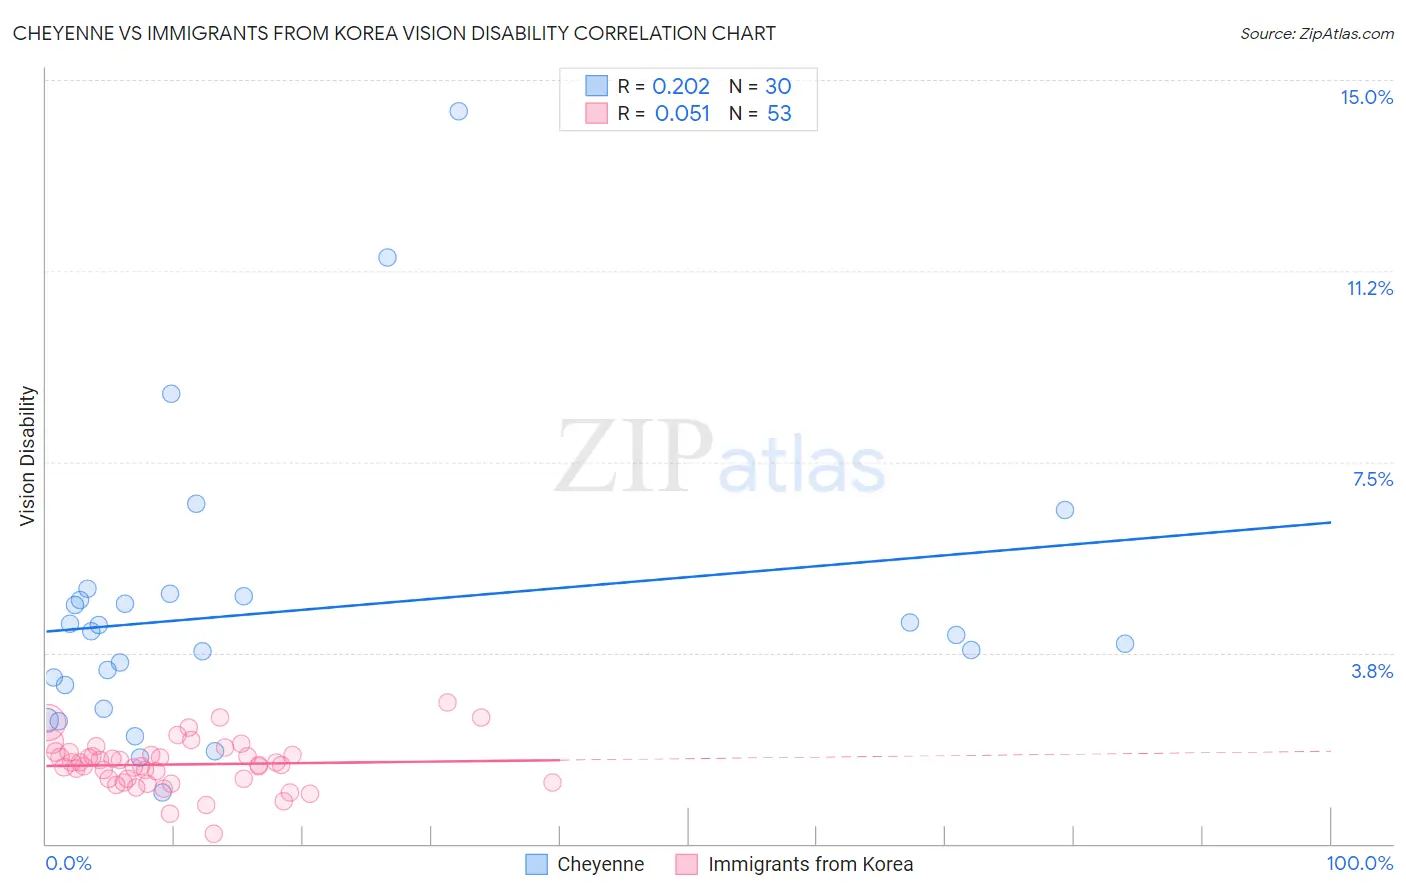
Cheyenne vs Immigrants from Korea Vision Disability Correlation Chart
The statistical analysis conducted on geographies consisting of 80,705,474 people shows a weak positive correlation between the proportion of Cheyenne and percentage of population with vision disability in the United States with a correlation coefficient (R) of 0.202 and weighted average of 3.1%. Similarly, the statistical analysis conducted on geographies consisting of 415,890,370 people shows a slight positive correlation between the proportion of Immigrants from Korea and percentage of population with vision disability in the United States with a correlation coefficient (R) of 0.051 and weighted average of 1.8%, a difference of 69.1%.
Vision Disability Correlation Summary
| Measurement | Cheyenne | Immigrants from Korea |
| Minimum | 1.0% | 0.21% |
| Maximum | 14.4% | 2.8% |
| Range | 13.4% | 2.6% |
| Mean | 4.6% | 1.6% |
| Median | 4.1% | 1.5% |
| Interquartile 25% (IQ1) | 3.1% | 1.2% |
| Interquartile 75% (IQ3) | 4.9% | 1.8% |
| Interquartile Range (IQR) | 1.7% | 0.53% |
| Standard Deviation (Sample) | 2.8% | 0.48% |
| Standard Deviation (Population) | 2.8% | 0.47% |
Similar Demographics by Vision Disability
Demographics Similar to Cheyenne by Vision Disability
In terms of vision disability, the demographic groups most similar to Cheyenne are Cajun (3.1%, a difference of 1.1%), Seminole (3.1%, a difference of 1.1%), Central American Indian (3.0%, a difference of 1.5%), Navajo (3.1%, a difference of 1.7%), and Alaskan Athabascan (3.1%, a difference of 1.8%).
| Demographics | Rating | Rank | Vision Disability |
| Natives/Alaskans | 0.0 /100 | #327 | Tragic 3.0% |
| Yuman | 0.0 /100 | #328 | Tragic 3.0% |
| Apache | 0.0 /100 | #329 | Tragic 3.0% |
| Colville | 0.0 /100 | #330 | Tragic 3.0% |
| Central American Indians | 0.0 /100 | #331 | Tragic 3.0% |
| Seminole | 0.0 /100 | #332 | Tragic 3.1% |
| Cajuns | 0.0 /100 | #333 | Tragic 3.1% |
| Cheyenne | 0.0 /100 | #334 | Tragic 3.1% |
| Navajo | 0.0 /100 | #335 | Tragic 3.1% |
| Alaskan Athabascans | 0.0 /100 | #336 | Tragic 3.1% |
| Dutch West Indians | 0.0 /100 | #337 | Tragic 3.2% |
| Chickasaw | 0.0 /100 | #338 | Tragic 3.2% |
| Tsimshian | 0.0 /100 | #339 | Tragic 3.2% |
| Creek | 0.0 /100 | #340 | Tragic 3.2% |
| Kiowa | 0.0 /100 | #341 | Tragic 3.3% |
Demographics Similar to Immigrants from Korea by Vision Disability
In terms of vision disability, the demographic groups most similar to Immigrants from Korea are Immigrants from Eastern Asia (1.8%, a difference of 0.080%), Immigrants from China (1.8%, a difference of 0.22%), Immigrants from Israel (1.8%, a difference of 0.23%), Immigrants from Bolivia (1.8%, a difference of 0.65%), and Indian (Asian) (1.8%, a difference of 1.1%).
| Demographics | Rating | Rank | Vision Disability |
| Okinawans | 100.0 /100 | #5 | Exceptional 1.8% |
| Immigrants | Iran | 100.0 /100 | #6 | Exceptional 1.8% |
| Immigrants | South Central Asia | 100.0 /100 | #7 | Exceptional 1.8% |
| Iranians | 100.0 /100 | #8 | Exceptional 1.8% |
| Immigrants | Singapore | 100.0 /100 | #9 | Exceptional 1.8% |
| Immigrants | Hong Kong | 100.0 /100 | #10 | Exceptional 1.8% |
| Immigrants | Israel | 100.0 /100 | #11 | Exceptional 1.8% |
| Immigrants | Korea | 100.0 /100 | #12 | Exceptional 1.8% |
| Immigrants | Eastern Asia | 100.0 /100 | #13 | Exceptional 1.8% |
| Immigrants | China | 100.0 /100 | #14 | Exceptional 1.8% |
| Immigrants | Bolivia | 100.0 /100 | #15 | Exceptional 1.8% |
| Indians (Asian) | 100.0 /100 | #16 | Exceptional 1.8% |
| Burmese | 100.0 /100 | #17 | Exceptional 1.8% |
| Bolivians | 100.0 /100 | #18 | Exceptional 1.9% |
| Immigrants | Sri Lanka | 100.0 /100 | #19 | Exceptional 1.9% |