Bhutanese vs Bulgarian Female Disability
COMPARE
Bhutanese
Bulgarian
Female Disability
Female Disability Comparison
Bhutanese
Bulgarians
11.5%
FEMALE DISABILITY
99.8/ 100
METRIC RATING
74th/ 347
METRIC RANK
11.3%
FEMALE DISABILITY
99.9/ 100
METRIC RATING
55th/ 347
METRIC RANK
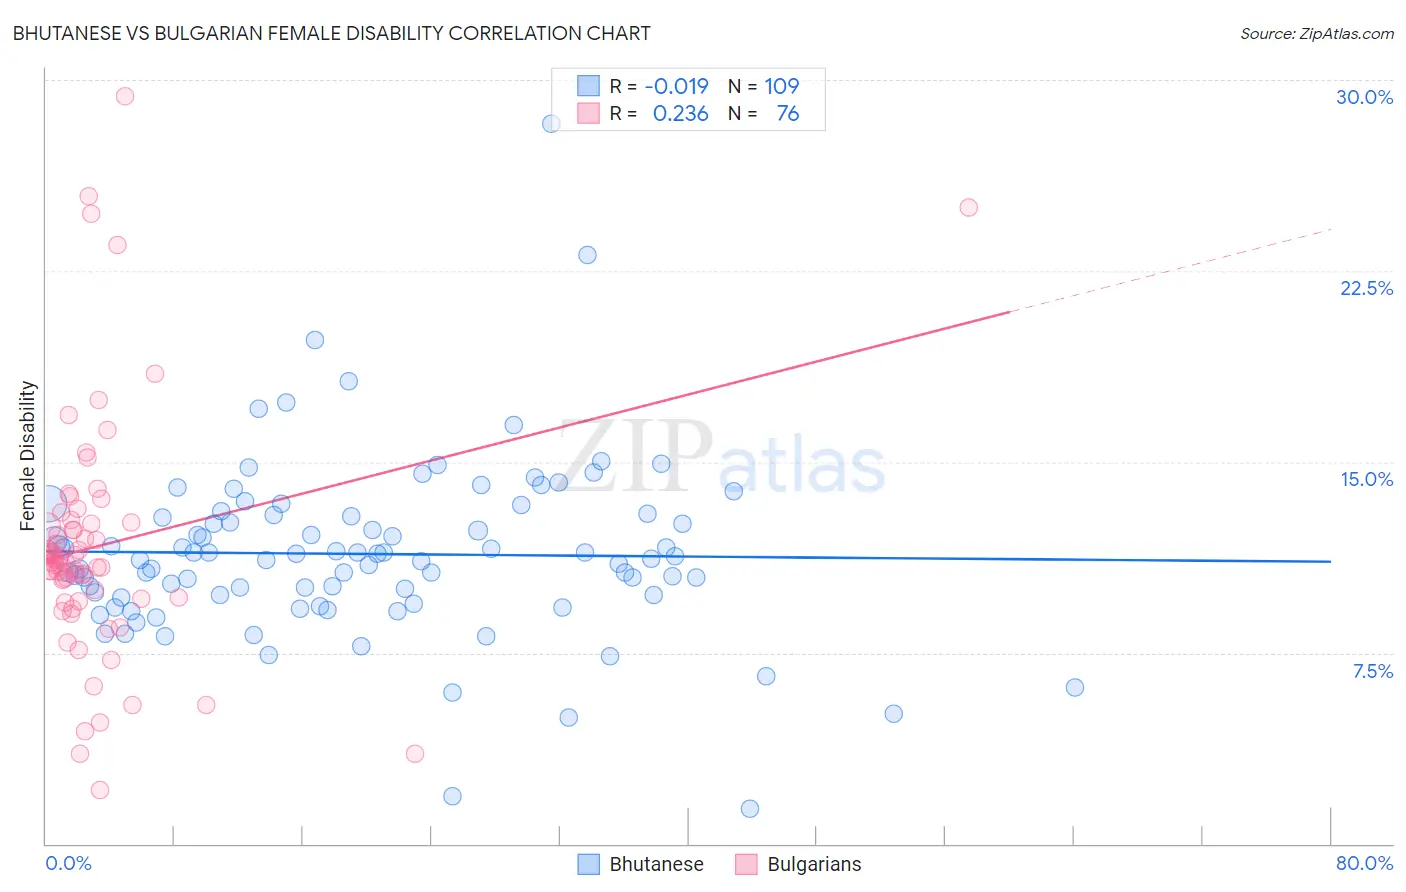
Bhutanese vs Bulgarian Female Disability Correlation Chart
The statistical analysis conducted on geographies consisting of 455,486,745 people shows no correlation between the proportion of Bhutanese and percentage of females with a disability in the United States with a correlation coefficient (R) of -0.019 and weighted average of 11.5%. Similarly, the statistical analysis conducted on geographies consisting of 205,628,726 people shows a weak positive correlation between the proportion of Bulgarians and percentage of females with a disability in the United States with a correlation coefficient (R) of 0.236 and weighted average of 11.3%, a difference of 1.5%.
Female Disability Correlation Summary
| Measurement | Bhutanese | Bulgarian |
| Minimum | 1.4% | 2.1% |
| Maximum | 28.3% | 29.3% |
| Range | 26.9% | 27.2% |
| Mean | 11.4% | 11.7% |
| Median | 11.2% | 11.1% |
| Interquartile 25% (IQ1) | 9.7% | 9.6% |
| Interquartile 75% (IQ3) | 12.9% | 12.6% |
| Interquartile Range (IQR) | 3.2% | 2.9% |
| Standard Deviation (Sample) | 3.5% | 4.8% |
| Standard Deviation (Population) | 3.5% | 4.8% |
Demographics Similar to Bhutanese and Bulgarians by Female Disability
In terms of female disability, the demographic groups most similar to Bhutanese are Immigrants from Switzerland (11.5%, a difference of 0.080%), Chilean (11.5%, a difference of 0.090%), Immigrants from Ireland (11.5%, a difference of 0.16%), Immigrants from Chile (11.5%, a difference of 0.21%), and Colombian (11.5%, a difference of 0.22%). Similarly, the demographic groups most similar to Bulgarians are Peruvian (11.3%, a difference of 0.020%), Taiwanese (11.4%, a difference of 0.23%), South American (11.4%, a difference of 0.31%), Laotian (11.4%, a difference of 0.33%), and Immigrants from Spain (11.4%, a difference of 0.46%).
| Demographics | Rating | Rank | Female Disability |
| Peruvians | 99.9 /100 | #54 | Exceptional 11.3% |
| Bulgarians | 99.9 /100 | #55 | Exceptional 11.3% |
| Taiwanese | 99.9 /100 | #56 | Exceptional 11.4% |
| South Americans | 99.9 /100 | #57 | Exceptional 11.4% |
| Laotians | 99.9 /100 | #58 | Exceptional 11.4% |
| Immigrants | Spain | 99.9 /100 | #59 | Exceptional 11.4% |
| Immigrants | Bulgaria | 99.9 /100 | #60 | Exceptional 11.4% |
| Immigrants | France | 99.9 /100 | #61 | Exceptional 11.4% |
| Sri Lankans | 99.9 /100 | #62 | Exceptional 11.4% |
| Immigrants | Colombia | 99.9 /100 | #63 | Exceptional 11.4% |
| Immigrants | El Salvador | 99.9 /100 | #64 | Exceptional 11.4% |
| Immigrants | South America | 99.9 /100 | #65 | Exceptional 11.4% |
| Salvadorans | 99.8 /100 | #66 | Exceptional 11.5% |
| Immigrants | Vietnam | 99.8 /100 | #67 | Exceptional 11.5% |
| Immigrants | Northern Africa | 99.8 /100 | #68 | Exceptional 11.5% |
| Colombians | 99.8 /100 | #69 | Exceptional 11.5% |
| Immigrants | Chile | 99.8 /100 | #70 | Exceptional 11.5% |
| Immigrants | Ireland | 99.8 /100 | #71 | Exceptional 11.5% |
| Chileans | 99.8 /100 | #72 | Exceptional 11.5% |
| Immigrants | Switzerland | 99.8 /100 | #73 | Exceptional 11.5% |
| Bhutanese | 99.8 /100 | #74 | Exceptional 11.5% |