Bhutanese vs Bulgarian Child Poverty Under the Age of 16
COMPARE
Bhutanese
Bulgarian
Child Poverty Under the Age of 16
Child Poverty Under the Age of 16 Comparison
Bhutanese
Bulgarians
12.5%
CHILD POVERTY UNDER THE AGE OF 16
99.9/ 100
METRIC RATING
11th/ 347
METRIC RANK
13.0%
CHILD POVERTY UNDER THE AGE OF 16
99.9/ 100
METRIC RATING
17th/ 347
METRIC RANK
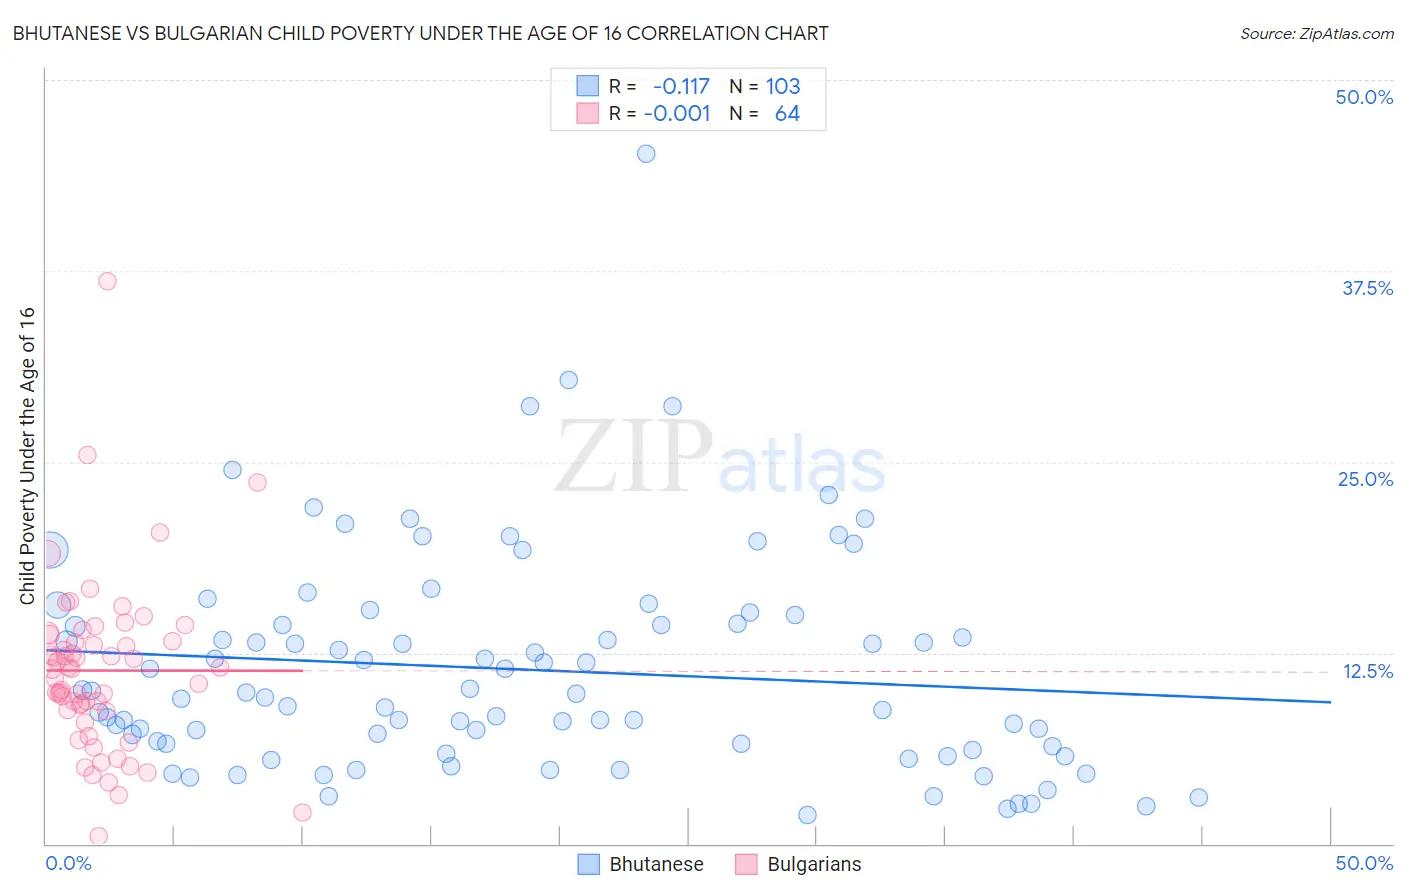
Bhutanese vs Bulgarian Child Poverty Under the Age of 16 Correlation Chart
The statistical analysis conducted on geographies consisting of 450,361,741 people shows a poor negative correlation between the proportion of Bhutanese and poverty level among children under the age of 16 in the United States with a correlation coefficient (R) of -0.117 and weighted average of 12.5%. Similarly, the statistical analysis conducted on geographies consisting of 204,354,998 people shows no correlation between the proportion of Bulgarians and poverty level among children under the age of 16 in the United States with a correlation coefficient (R) of -0.001 and weighted average of 13.0%, a difference of 3.7%.
Child Poverty Under the Age of 16 Correlation Summary
| Measurement | Bhutanese | Bulgarian |
| Minimum | 1.9% | 0.47% |
| Maximum | 45.2% | 36.8% |
| Range | 43.3% | 36.4% |
| Mean | 11.4% | 11.3% |
| Median | 9.8% | 11.4% |
| Interquartile 25% (IQ1) | 6.4% | 8.7% |
| Interquartile 75% (IQ3) | 14.4% | 13.5% |
| Interquartile Range (IQR) | 8.1% | 4.8% |
| Standard Deviation (Sample) | 7.1% | 5.7% |
| Standard Deviation (Population) | 7.1% | 5.6% |
Demographics Similar to Bhutanese and Bulgarians by Child Poverty Under the Age of 16
In terms of child poverty under the age of 16, the demographic groups most similar to Bhutanese are Immigrants from South Central Asia (12.5%, a difference of 0.010%), Immigrants from Ireland (12.7%, a difference of 1.1%), Immigrants from Iran (12.4%, a difference of 1.2%), Immigrants from Singapore (12.4%, a difference of 1.3%), and Burmese (12.8%, a difference of 2.2%). Similarly, the demographic groups most similar to Bulgarians are Norwegian (13.0%, a difference of 0.22%), Immigrants from Korea (13.0%, a difference of 0.27%), Cypriot (13.0%, a difference of 0.42%), Immigrants from Japan (13.0%, a difference of 0.45%), and Immigrants from Lithuania (12.9%, a difference of 0.58%).
| Demographics | Rating | Rank | Child Poverty Under the Age of 16 |
| Thais | 100.0 /100 | #4 | Exceptional 11.6% |
| Chinese | 100.0 /100 | #5 | Exceptional 11.9% |
| Immigrants | Hong Kong | 100.0 /100 | #6 | Exceptional 12.1% |
| Iranians | 100.0 /100 | #7 | Exceptional 12.2% |
| Immigrants | Singapore | 100.0 /100 | #8 | Exceptional 12.4% |
| Immigrants | Iran | 100.0 /100 | #9 | Exceptional 12.4% |
| Immigrants | South Central Asia | 99.9 /100 | #10 | Exceptional 12.5% |
| Bhutanese | 99.9 /100 | #11 | Exceptional 12.5% |
| Immigrants | Ireland | 99.9 /100 | #12 | Exceptional 12.7% |
| Burmese | 99.9 /100 | #13 | Exceptional 12.8% |
| Immigrants | Lithuania | 99.9 /100 | #14 | Exceptional 12.9% |
| Immigrants | Korea | 99.9 /100 | #15 | Exceptional 13.0% |
| Norwegians | 99.9 /100 | #16 | Exceptional 13.0% |
| Bulgarians | 99.9 /100 | #17 | Exceptional 13.0% |
| Cypriots | 99.9 /100 | #18 | Exceptional 13.0% |
| Immigrants | Japan | 99.8 /100 | #19 | Exceptional 13.0% |
| Okinawans | 99.8 /100 | #20 | Exceptional 13.1% |
| Immigrants | Eastern Asia | 99.8 /100 | #21 | Exceptional 13.1% |
| Maltese | 99.8 /100 | #22 | Exceptional 13.1% |
| Indians (Asian) | 99.8 /100 | #23 | Exceptional 13.1% |
| Latvians | 99.8 /100 | #24 | Exceptional 13.2% |