Lebanese vs Bulgarian Female Disability
COMPARE
Lebanese
Bulgarian
Female Disability
Female Disability Comparison
Lebanese
Bulgarians
12.2%
FEMALE DISABILITY
58.1/ 100
METRIC RATING
169th/ 347
METRIC RANK
11.3%
FEMALE DISABILITY
99.9/ 100
METRIC RATING
55th/ 347
METRIC RANK
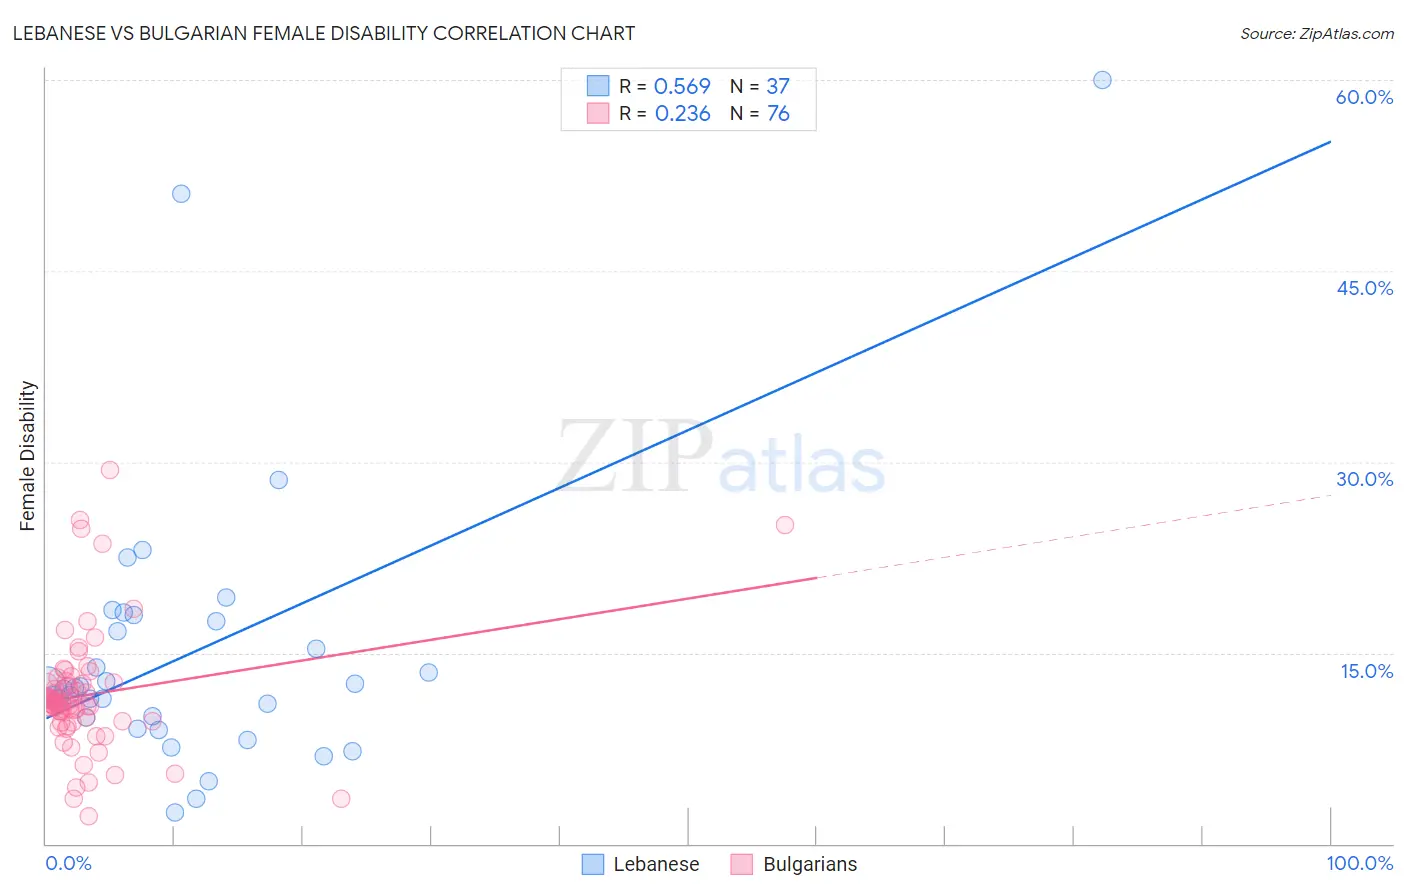
Lebanese vs Bulgarian Female Disability Correlation Chart
The statistical analysis conducted on geographies consisting of 401,580,579 people shows a substantial positive correlation between the proportion of Lebanese and percentage of females with a disability in the United States with a correlation coefficient (R) of 0.569 and weighted average of 12.2%. Similarly, the statistical analysis conducted on geographies consisting of 205,628,726 people shows a weak positive correlation between the proportion of Bulgarians and percentage of females with a disability in the United States with a correlation coefficient (R) of 0.236 and weighted average of 11.3%, a difference of 7.2%.
Female Disability Correlation Summary
| Measurement | Lebanese | Bulgarian |
| Minimum | 2.4% | 2.1% |
| Maximum | 60.0% | 29.3% |
| Range | 57.6% | 27.2% |
| Mean | 15.1% | 11.7% |
| Median | 12.3% | 11.1% |
| Interquartile 25% (IQ1) | 9.5% | 9.6% |
| Interquartile 75% (IQ3) | 17.8% | 12.6% |
| Interquartile Range (IQR) | 8.3% | 2.9% |
| Standard Deviation (Sample) | 11.2% | 4.8% |
| Standard Deviation (Population) | 11.1% | 4.8% |
Similar Demographics by Female Disability
Demographics Similar to Lebanese by Female Disability
In terms of female disability, the demographic groups most similar to Lebanese are Immigrants from Haiti (12.2%, a difference of 0.030%), Immigrants from Latin America (12.2%, a difference of 0.040%), Maltese (12.2%, a difference of 0.040%), Lithuanian (12.2%, a difference of 0.050%), and Immigrants from Southern Europe (12.2%, a difference of 0.070%).
| Demographics | Rating | Rank | Female Disability |
| Immigrants | Ukraine | 64.3 /100 | #162 | Good 12.1% |
| Guatemalans | 63.8 /100 | #163 | Good 12.1% |
| Czechs | 63.6 /100 | #164 | Good 12.1% |
| Immigrants | Oceania | 61.8 /100 | #165 | Good 12.1% |
| Lithuanians | 59.5 /100 | #166 | Average 12.2% |
| Immigrants | Latin America | 59.0 /100 | #167 | Average 12.2% |
| Immigrants | Haiti | 58.8 /100 | #168 | Average 12.2% |
| Lebanese | 58.1 /100 | #169 | Average 12.2% |
| Maltese | 57.0 /100 | #170 | Average 12.2% |
| Immigrants | Southern Europe | 56.3 /100 | #171 | Average 12.2% |
| Haitians | 51.9 /100 | #172 | Average 12.2% |
| Immigrants | Mexico | 50.8 /100 | #173 | Average 12.2% |
| Immigrants | England | 50.0 /100 | #174 | Average 12.2% |
| Immigrants | St. Vincent and the Grenadines | 49.7 /100 | #175 | Average 12.2% |
| Immigrants | Guyana | 43.1 /100 | #176 | Average 12.2% |
Demographics Similar to Bulgarians by Female Disability
In terms of female disability, the demographic groups most similar to Bulgarians are Peruvian (11.3%, a difference of 0.020%), Immigrants from Saudi Arabia (11.3%, a difference of 0.070%), Immigrants from Peru (11.3%, a difference of 0.12%), Taiwanese (11.4%, a difference of 0.23%), and Immigrants from Belgium (11.3%, a difference of 0.24%).
| Demographics | Rating | Rank | Female Disability |
| Zimbabweans | 100.0 /100 | #48 | Exceptional 11.3% |
| Tongans | 100.0 /100 | #49 | Exceptional 11.3% |
| Inupiat | 100.0 /100 | #50 | Exceptional 11.3% |
| Immigrants | Belgium | 100.0 /100 | #51 | Exceptional 11.3% |
| Immigrants | Peru | 99.9 /100 | #52 | Exceptional 11.3% |
| Immigrants | Saudi Arabia | 99.9 /100 | #53 | Exceptional 11.3% |
| Peruvians | 99.9 /100 | #54 | Exceptional 11.3% |
| Bulgarians | 99.9 /100 | #55 | Exceptional 11.3% |
| Taiwanese | 99.9 /100 | #56 | Exceptional 11.4% |
| South Americans | 99.9 /100 | #57 | Exceptional 11.4% |
| Laotians | 99.9 /100 | #58 | Exceptional 11.4% |
| Immigrants | Spain | 99.9 /100 | #59 | Exceptional 11.4% |
| Immigrants | Bulgaria | 99.9 /100 | #60 | Exceptional 11.4% |
| Immigrants | France | 99.9 /100 | #61 | Exceptional 11.4% |
| Sri Lankans | 99.9 /100 | #62 | Exceptional 11.4% |