Bhutanese vs South American Indian Female Disability
COMPARE
Bhutanese
South American Indian
Female Disability
Female Disability Comparison
Bhutanese
South American Indians
11.5%
FEMALE DISABILITY
99.8/ 100
METRIC RATING
74th/ 347
METRIC RANK
11.8%
FEMALE DISABILITY
95.8/ 100
METRIC RATING
127th/ 347
METRIC RANK
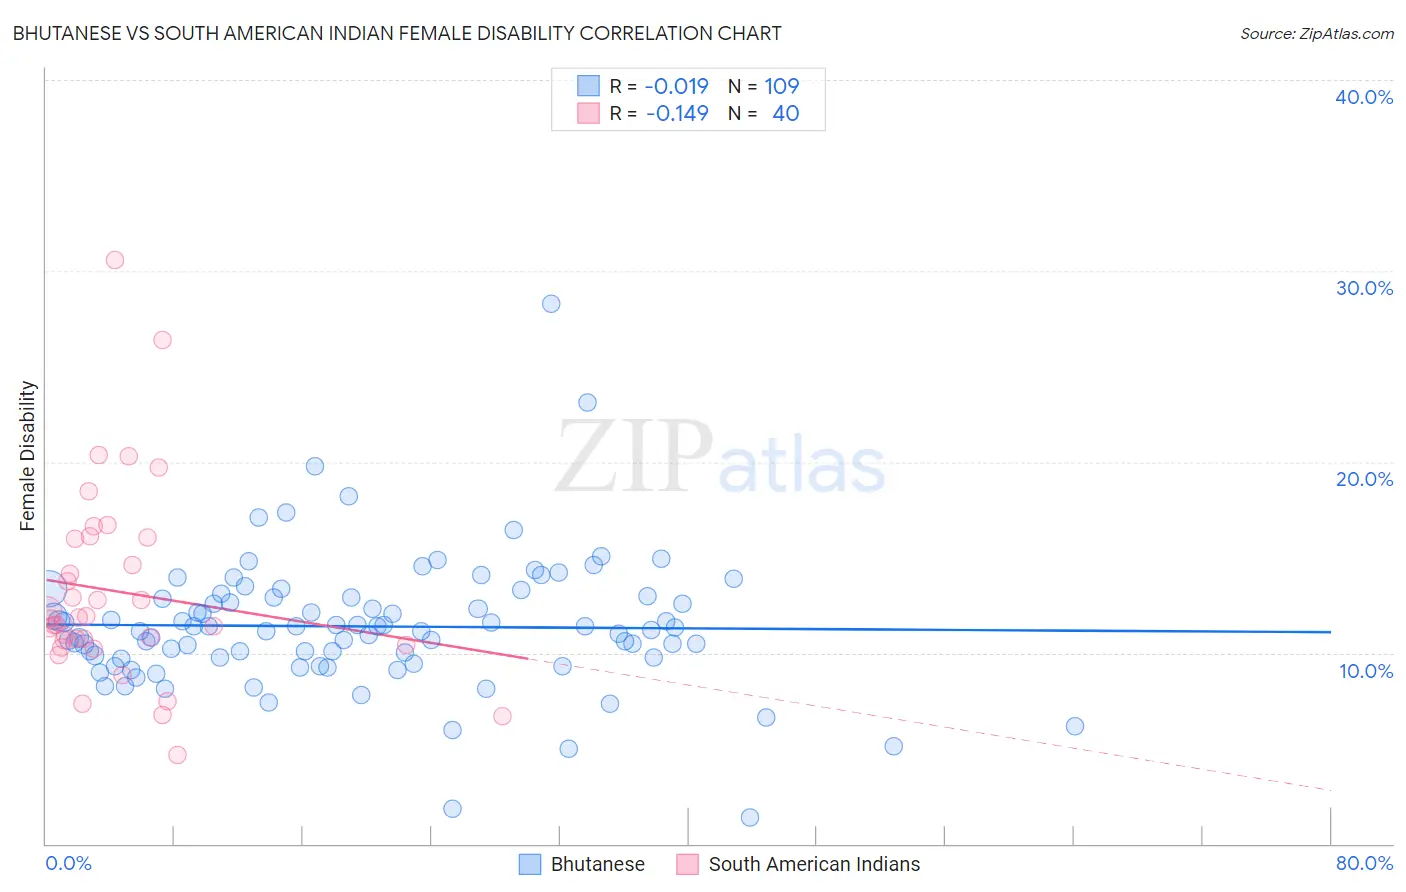
Bhutanese vs South American Indian Female Disability Correlation Chart
The statistical analysis conducted on geographies consisting of 455,486,745 people shows no correlation between the proportion of Bhutanese and percentage of females with a disability in the United States with a correlation coefficient (R) of -0.019 and weighted average of 11.5%. Similarly, the statistical analysis conducted on geographies consisting of 164,561,575 people shows a poor negative correlation between the proportion of South American Indians and percentage of females with a disability in the United States with a correlation coefficient (R) of -0.149 and weighted average of 11.8%, a difference of 2.9%.
Female Disability Correlation Summary
| Measurement | Bhutanese | South American Indian |
| Minimum | 1.4% | 4.7% |
| Maximum | 28.3% | 30.6% |
| Range | 26.9% | 25.9% |
| Mean | 11.4% | 13.2% |
| Median | 11.2% | 11.8% |
| Interquartile 25% (IQ1) | 9.7% | 10.5% |
| Interquartile 75% (IQ3) | 12.9% | 16.0% |
| Interquartile Range (IQR) | 3.2% | 5.5% |
| Standard Deviation (Sample) | 3.5% | 5.1% |
| Standard Deviation (Population) | 3.5% | 5.1% |
Similar Demographics by Female Disability
Demographics Similar to Bhutanese by Female Disability
In terms of female disability, the demographic groups most similar to Bhutanese are Immigrants from Switzerland (11.5%, a difference of 0.080%), Chilean (11.5%, a difference of 0.090%), Immigrants from Lebanon (11.5%, a difference of 0.12%), Immigrants from Eritrea (11.5%, a difference of 0.15%), and Immigrants from Afghanistan (11.5%, a difference of 0.15%).
| Demographics | Rating | Rank | Female Disability |
| Immigrants | Vietnam | 99.8 /100 | #67 | Exceptional 11.5% |
| Immigrants | Northern Africa | 99.8 /100 | #68 | Exceptional 11.5% |
| Colombians | 99.8 /100 | #69 | Exceptional 11.5% |
| Immigrants | Chile | 99.8 /100 | #70 | Exceptional 11.5% |
| Immigrants | Ireland | 99.8 /100 | #71 | Exceptional 11.5% |
| Chileans | 99.8 /100 | #72 | Exceptional 11.5% |
| Immigrants | Switzerland | 99.8 /100 | #73 | Exceptional 11.5% |
| Bhutanese | 99.8 /100 | #74 | Exceptional 11.5% |
| Immigrants | Lebanon | 99.7 /100 | #75 | Exceptional 11.5% |
| Immigrants | Eritrea | 99.7 /100 | #76 | Exceptional 11.5% |
| Immigrants | Afghanistan | 99.7 /100 | #77 | Exceptional 11.5% |
| Immigrants | South Africa | 99.7 /100 | #78 | Exceptional 11.5% |
| Sierra Leoneans | 99.7 /100 | #79 | Exceptional 11.5% |
| Immigrants | Jordan | 99.7 /100 | #80 | Exceptional 11.5% |
| Eastern Europeans | 99.7 /100 | #81 | Exceptional 11.5% |
Demographics Similar to South American Indians by Female Disability
In terms of female disability, the demographic groups most similar to South American Indians are Immigrants from Latvia (11.8%, a difference of 0.040%), Macedonian (11.8%, a difference of 0.070%), Immigrants from Europe (11.8%, a difference of 0.10%), Nicaraguan (11.9%, a difference of 0.13%), and Arab (11.9%, a difference of 0.16%).
| Demographics | Rating | Rank | Female Disability |
| Immigrants | Kazakhstan | 97.0 /100 | #120 | Exceptional 11.8% |
| Immigrants | Netherlands | 96.9 /100 | #121 | Exceptional 11.8% |
| Immigrants | North Macedonia | 96.8 /100 | #122 | Exceptional 11.8% |
| Immigrants | Croatia | 96.7 /100 | #123 | Exceptional 11.8% |
| Russians | 96.5 /100 | #124 | Exceptional 11.8% |
| Immigrants | Italy | 96.4 /100 | #125 | Exceptional 11.8% |
| Immigrants | Europe | 96.2 /100 | #126 | Exceptional 11.8% |
| South American Indians | 95.8 /100 | #127 | Exceptional 11.8% |
| Immigrants | Latvia | 95.6 /100 | #128 | Exceptional 11.8% |
| Macedonians | 95.5 /100 | #129 | Exceptional 11.8% |
| Nicaraguans | 95.2 /100 | #130 | Exceptional 11.9% |
| Arabs | 95.1 /100 | #131 | Exceptional 11.9% |
| Immigrants | Syria | 94.6 /100 | #132 | Exceptional 11.9% |
| Kenyans | 94.5 /100 | #133 | Exceptional 11.9% |
| Immigrants | Nicaragua | 94.5 /100 | #134 | Exceptional 11.9% |