Immigrants from Cambodia vs Bulgarian Female Disability
COMPARE
Immigrants from Cambodia
Bulgarian
Female Disability
Female Disability Comparison
Immigrants from Cambodia
Bulgarians
12.5%
FEMALE DISABILITY
7.8/ 100
METRIC RATING
228th/ 347
METRIC RANK
11.3%
FEMALE DISABILITY
99.9/ 100
METRIC RATING
55th/ 347
METRIC RANK
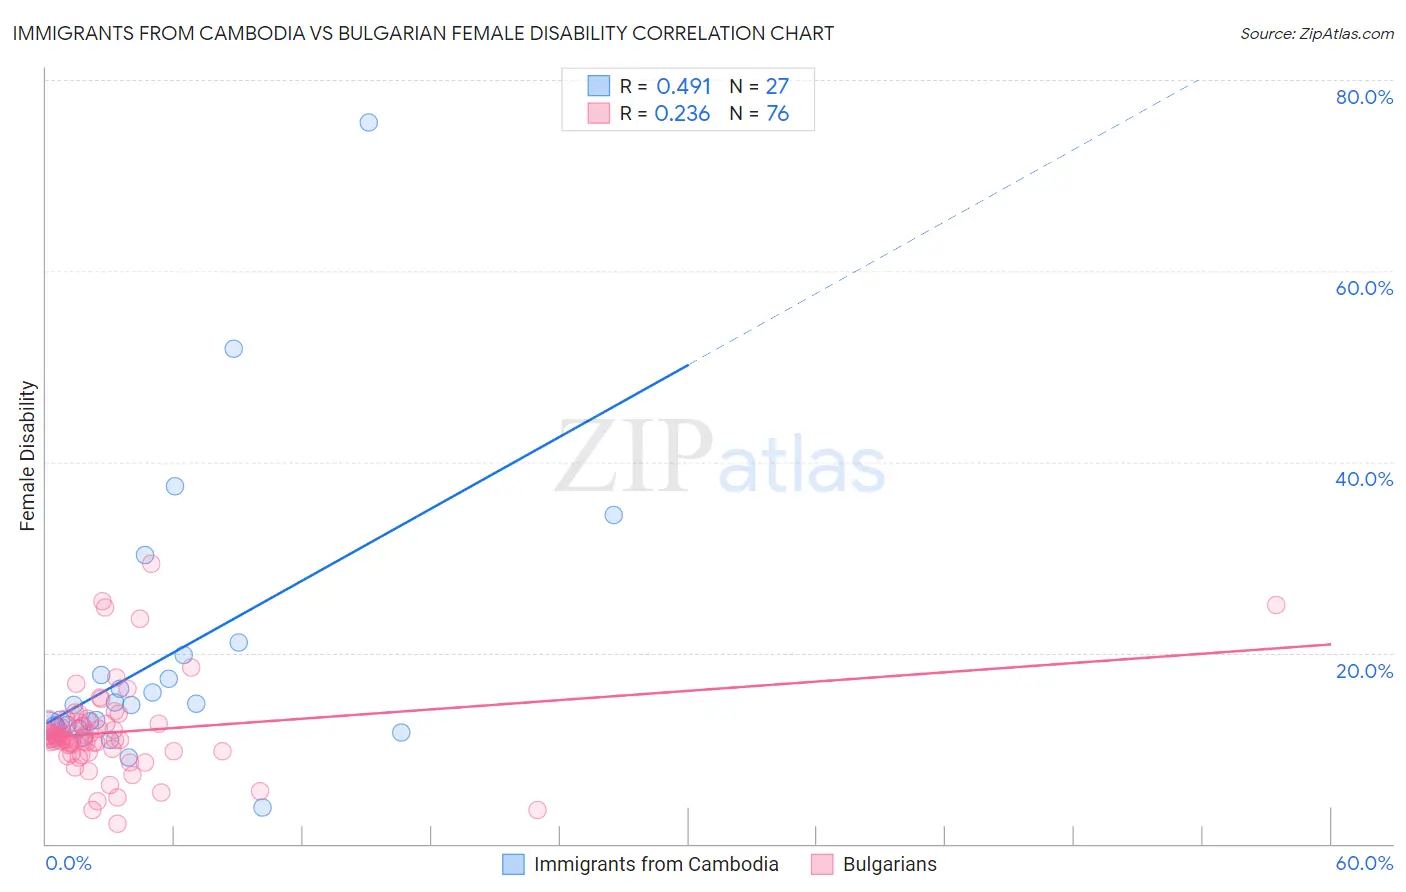
Immigrants from Cambodia vs Bulgarian Female Disability Correlation Chart
The statistical analysis conducted on geographies consisting of 205,152,256 people shows a moderate positive correlation between the proportion of Immigrants from Cambodia and percentage of females with a disability in the United States with a correlation coefficient (R) of 0.491 and weighted average of 12.5%. Similarly, the statistical analysis conducted on geographies consisting of 205,628,726 people shows a weak positive correlation between the proportion of Bulgarians and percentage of females with a disability in the United States with a correlation coefficient (R) of 0.236 and weighted average of 11.3%, a difference of 10.1%.
Female Disability Correlation Summary
| Measurement | Immigrants from Cambodia | Bulgarian |
| Minimum | 3.8% | 2.1% |
| Maximum | 75.5% | 29.3% |
| Range | 71.7% | 27.2% |
| Mean | 19.6% | 11.7% |
| Median | 14.5% | 11.1% |
| Interquartile 25% (IQ1) | 12.0% | 9.6% |
| Interquartile 75% (IQ3) | 19.8% | 12.6% |
| Interquartile Range (IQR) | 7.8% | 2.9% |
| Standard Deviation (Sample) | 15.0% | 4.8% |
| Standard Deviation (Population) | 14.8% | 4.8% |
Similar Demographics by Female Disability
Demographics Similar to Immigrants from Cambodia by Female Disability
In terms of female disability, the demographic groups most similar to Immigrants from Cambodia are Hispanic or Latino (12.5%, a difference of 0.030%), Assyrian/Chaldean/Syriac (12.5%, a difference of 0.030%), Hungarian (12.5%, a difference of 0.070%), Polish (12.5%, a difference of 0.080%), and Immigrants from Belize (12.5%, a difference of 0.11%).
| Demographics | Rating | Rank | Female Disability |
| Native Hawaiians | 10.8 /100 | #221 | Poor 12.4% |
| Italians | 10.7 /100 | #222 | Poor 12.4% |
| Guamanians/Chamorros | 9.5 /100 | #223 | Tragic 12.5% |
| Belizeans | 9.3 /100 | #224 | Tragic 12.5% |
| Poles | 8.4 /100 | #225 | Tragic 12.5% |
| Hispanics or Latinos | 8.0 /100 | #226 | Tragic 12.5% |
| Assyrians/Chaldeans/Syriacs | 8.0 /100 | #227 | Tragic 12.5% |
| Immigrants | Cambodia | 7.8 /100 | #228 | Tragic 12.5% |
| Hungarians | 7.2 /100 | #229 | Tragic 12.5% |
| Immigrants | Belize | 7.0 /100 | #230 | Tragic 12.5% |
| Belgians | 6.5 /100 | #231 | Tragic 12.5% |
| Immigrants | Somalia | 5.9 /100 | #232 | Tragic 12.5% |
| Immigrants | Iraq | 5.3 /100 | #233 | Tragic 12.5% |
| Scandinavians | 5.3 /100 | #234 | Tragic 12.5% |
| Malaysians | 5.0 /100 | #235 | Tragic 12.5% |
Demographics Similar to Bulgarians by Female Disability
In terms of female disability, the demographic groups most similar to Bulgarians are Peruvian (11.3%, a difference of 0.020%), Immigrants from Saudi Arabia (11.3%, a difference of 0.070%), Immigrants from Peru (11.3%, a difference of 0.12%), Taiwanese (11.4%, a difference of 0.23%), and Immigrants from Belgium (11.3%, a difference of 0.24%).
| Demographics | Rating | Rank | Female Disability |
| Zimbabweans | 100.0 /100 | #48 | Exceptional 11.3% |
| Tongans | 100.0 /100 | #49 | Exceptional 11.3% |
| Inupiat | 100.0 /100 | #50 | Exceptional 11.3% |
| Immigrants | Belgium | 100.0 /100 | #51 | Exceptional 11.3% |
| Immigrants | Peru | 99.9 /100 | #52 | Exceptional 11.3% |
| Immigrants | Saudi Arabia | 99.9 /100 | #53 | Exceptional 11.3% |
| Peruvians | 99.9 /100 | #54 | Exceptional 11.3% |
| Bulgarians | 99.9 /100 | #55 | Exceptional 11.3% |
| Taiwanese | 99.9 /100 | #56 | Exceptional 11.4% |
| South Americans | 99.9 /100 | #57 | Exceptional 11.4% |
| Laotians | 99.9 /100 | #58 | Exceptional 11.4% |
| Immigrants | Spain | 99.9 /100 | #59 | Exceptional 11.4% |
| Immigrants | Bulgaria | 99.9 /100 | #60 | Exceptional 11.4% |
| Immigrants | France | 99.9 /100 | #61 | Exceptional 11.4% |
| Sri Lankans | 99.9 /100 | #62 | Exceptional 11.4% |