Bhutanese vs Immigrants from Armenia Female Disability
COMPARE
Bhutanese
Immigrants from Armenia
Female Disability
Female Disability Comparison
Bhutanese
Immigrants from Armenia
11.5%
FEMALE DISABILITY
99.8/ 100
METRIC RATING
74th/ 347
METRIC RANK
12.7%
FEMALE DISABILITY
1.0/ 100
METRIC RATING
259th/ 347
METRIC RANK
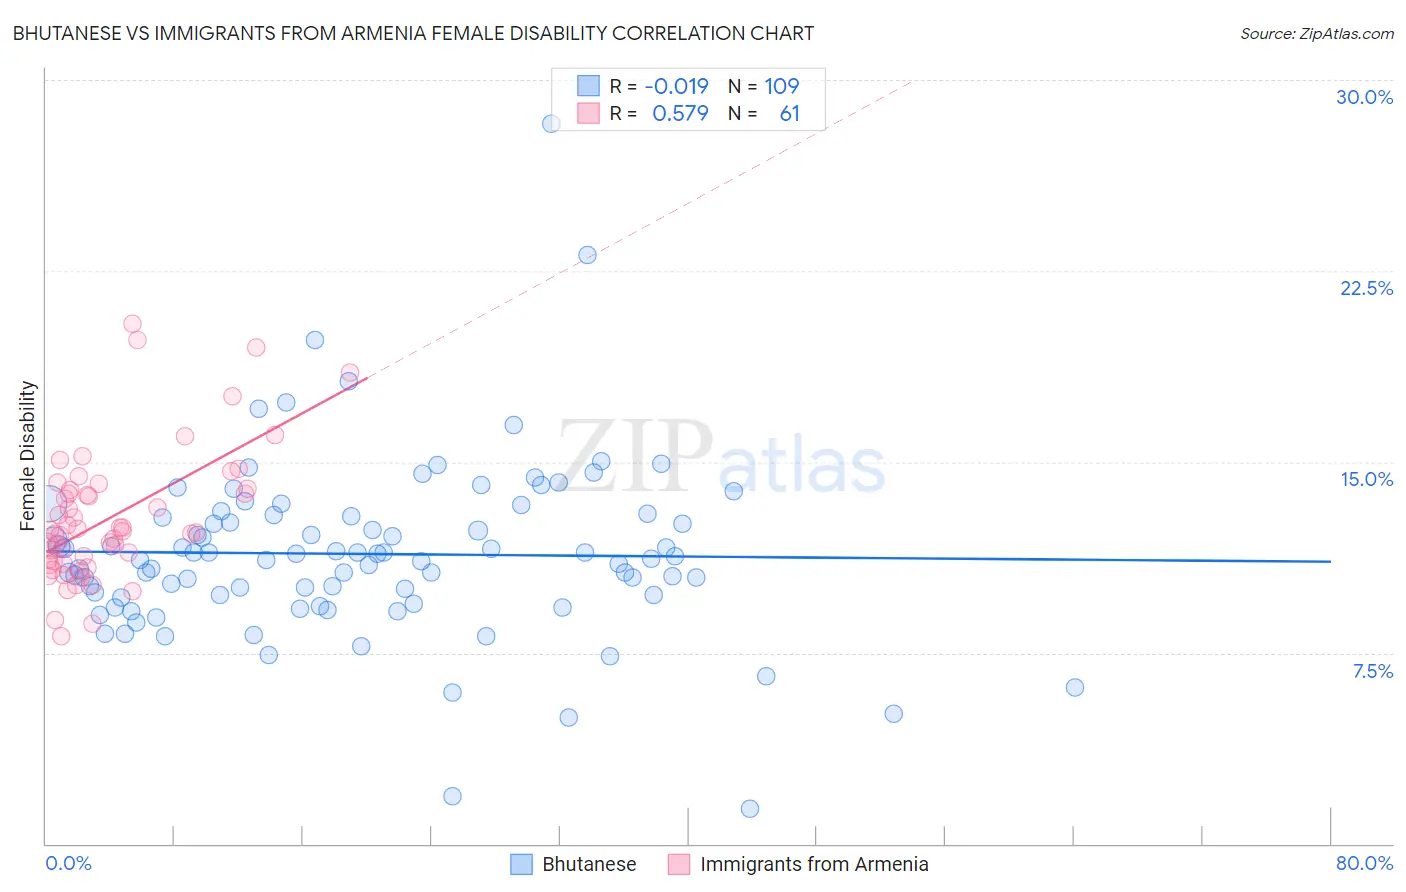
Bhutanese vs Immigrants from Armenia Female Disability Correlation Chart
The statistical analysis conducted on geographies consisting of 455,486,745 people shows no correlation between the proportion of Bhutanese and percentage of females with a disability in the United States with a correlation coefficient (R) of -0.019 and weighted average of 11.5%. Similarly, the statistical analysis conducted on geographies consisting of 97,707,143 people shows a substantial positive correlation between the proportion of Immigrants from Armenia and percentage of females with a disability in the United States with a correlation coefficient (R) of 0.579 and weighted average of 12.7%, a difference of 10.6%.
Female Disability Correlation Summary
| Measurement | Bhutanese | Immigrants from Armenia |
| Minimum | 1.4% | 8.2% |
| Maximum | 28.3% | 20.4% |
| Range | 26.9% | 12.2% |
| Mean | 11.4% | 12.8% |
| Median | 11.2% | 12.3% |
| Interquartile 25% (IQ1) | 9.7% | 11.0% |
| Interquartile 75% (IQ3) | 12.9% | 13.9% |
| Interquartile Range (IQR) | 3.2% | 2.9% |
| Standard Deviation (Sample) | 3.5% | 2.6% |
| Standard Deviation (Population) | 3.5% | 2.6% |
Similar Demographics by Female Disability
Demographics Similar to Bhutanese by Female Disability
In terms of female disability, the demographic groups most similar to Bhutanese are Immigrants from Switzerland (11.5%, a difference of 0.080%), Chilean (11.5%, a difference of 0.090%), Immigrants from Lebanon (11.5%, a difference of 0.12%), Immigrants from Eritrea (11.5%, a difference of 0.15%), and Immigrants from Afghanistan (11.5%, a difference of 0.15%).
| Demographics | Rating | Rank | Female Disability |
| Immigrants | Vietnam | 99.8 /100 | #67 | Exceptional 11.5% |
| Immigrants | Northern Africa | 99.8 /100 | #68 | Exceptional 11.5% |
| Colombians | 99.8 /100 | #69 | Exceptional 11.5% |
| Immigrants | Chile | 99.8 /100 | #70 | Exceptional 11.5% |
| Immigrants | Ireland | 99.8 /100 | #71 | Exceptional 11.5% |
| Chileans | 99.8 /100 | #72 | Exceptional 11.5% |
| Immigrants | Switzerland | 99.8 /100 | #73 | Exceptional 11.5% |
| Bhutanese | 99.8 /100 | #74 | Exceptional 11.5% |
| Immigrants | Lebanon | 99.7 /100 | #75 | Exceptional 11.5% |
| Immigrants | Eritrea | 99.7 /100 | #76 | Exceptional 11.5% |
| Immigrants | Afghanistan | 99.7 /100 | #77 | Exceptional 11.5% |
| Immigrants | South Africa | 99.7 /100 | #78 | Exceptional 11.5% |
| Sierra Leoneans | 99.7 /100 | #79 | Exceptional 11.5% |
| Immigrants | Jordan | 99.7 /100 | #80 | Exceptional 11.5% |
| Eastern Europeans | 99.7 /100 | #81 | Exceptional 11.5% |
Demographics Similar to Immigrants from Armenia by Female Disability
In terms of female disability, the demographic groups most similar to Immigrants from Armenia are Subsaharan African (12.7%, a difference of 0.010%), Bermudan (12.7%, a difference of 0.050%), Liberian (12.7%, a difference of 0.080%), Aleut (12.7%, a difference of 0.080%), and British West Indian (12.7%, a difference of 0.11%).
| Demographics | Rating | Rank | Female Disability |
| Immigrants | Caribbean | 1.4 /100 | #252 | Tragic 12.7% |
| Jamaicans | 1.4 /100 | #253 | Tragic 12.7% |
| Hawaiians | 1.4 /100 | #254 | Tragic 12.7% |
| Immigrants | Germany | 1.3 /100 | #255 | Tragic 12.7% |
| British West Indians | 1.2 /100 | #256 | Tragic 12.7% |
| Liberians | 1.1 /100 | #257 | Tragic 12.7% |
| Aleuts | 1.1 /100 | #258 | Tragic 12.7% |
| Immigrants | Armenia | 1.0 /100 | #259 | Tragic 12.7% |
| Sub-Saharan Africans | 1.0 /100 | #260 | Tragic 12.7% |
| Bermudans | 1.0 /100 | #261 | Tragic 12.7% |
| Czechoslovakians | 0.9 /100 | #262 | Tragic 12.7% |
| Spaniards | 0.7 /100 | #263 | Tragic 12.8% |
| Alaska Natives | 0.6 /100 | #264 | Tragic 12.8% |
| West Indians | 0.5 /100 | #265 | Tragic 12.8% |
| Finns | 0.4 /100 | #266 | Tragic 12.8% |