Belgian vs Fijian Disability Age Under 5
COMPARE
Belgian
Fijian
Disability Age Under 5
Disability Age Under 5 Comparison
Belgians
Fijians
1.4%
DISABILITY AGE UNDER 5
0.1/ 100
METRIC RATING
268th/ 347
METRIC RANK
1.2%
DISABILITY AGE UNDER 5
84.7/ 100
METRIC RATING
135th/ 347
METRIC RANK
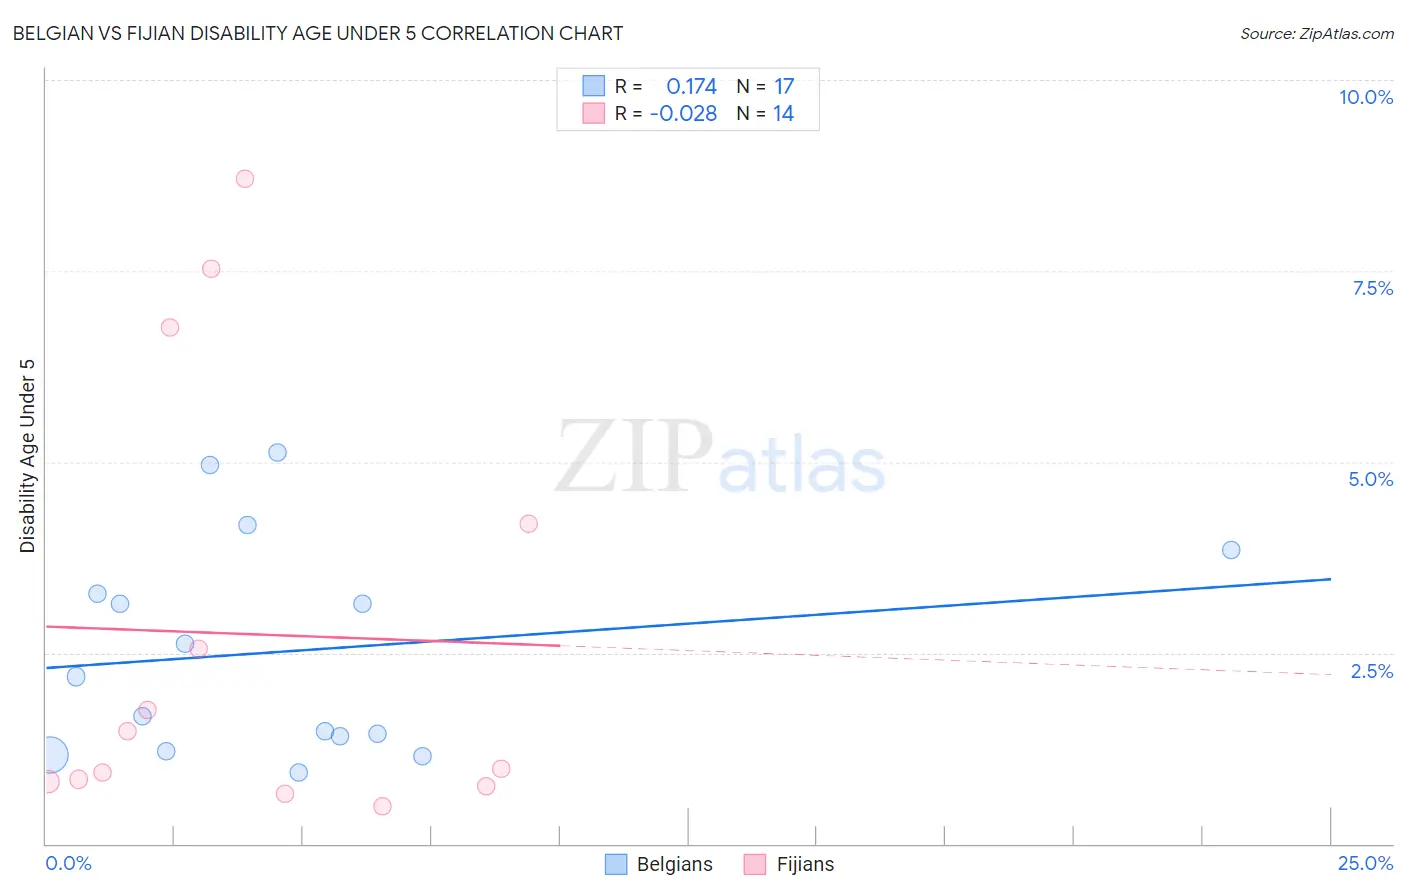
Belgian vs Fijian Disability Age Under 5 Correlation Chart
The statistical analysis conducted on geographies consisting of 192,782,941 people shows a poor positive correlation between the proportion of Belgians and percentage of population with a disability under the age of 5 in the United States with a correlation coefficient (R) of 0.174 and weighted average of 1.4%. Similarly, the statistical analysis conducted on geographies consisting of 45,950,279 people shows no correlation between the proportion of Fijians and percentage of population with a disability under the age of 5 in the United States with a correlation coefficient (R) of -0.028 and weighted average of 1.2%, a difference of 20.7%.
Disability Age Under 5 Correlation Summary
| Measurement | Belgian | Fijian |
| Minimum | 0.94% | 0.50% |
| Maximum | 5.1% | 8.7% |
| Range | 4.2% | 8.2% |
| Mean | 2.5% | 2.7% |
| Median | 2.2% | 1.2% |
| Interquartile 25% (IQ1) | 1.3% | 0.81% |
| Interquartile 75% (IQ3) | 3.6% | 4.2% |
| Interquartile Range (IQR) | 2.3% | 3.4% |
| Standard Deviation (Sample) | 1.4% | 2.9% |
| Standard Deviation (Population) | 1.3% | 2.8% |
Similar Demographics by Disability Age Under 5
Demographics Similar to Belgians by Disability Age Under 5
In terms of disability age under 5, the demographic groups most similar to Belgians are Austrian (1.4%, a difference of 0.18%), Immigrants from North America (1.4%, a difference of 0.31%), Immigrants from Canada (1.4%, a difference of 0.35%), Black/African American (1.4%, a difference of 0.51%), and Cree (1.4%, a difference of 0.58%).
| Demographics | Rating | Rank | Disability Age Under 5 |
| Immigrants | Netherlands | 0.2 /100 | #261 | Tragic 1.4% |
| Immigrants | Dominica | 0.2 /100 | #262 | Tragic 1.4% |
| Spanish | 0.2 /100 | #263 | Tragic 1.4% |
| Yugoslavians | 0.1 /100 | #264 | Tragic 1.4% |
| Carpatho Rusyns | 0.1 /100 | #265 | Tragic 1.4% |
| Immigrants | Germany | 0.1 /100 | #266 | Tragic 1.4% |
| Cree | 0.1 /100 | #267 | Tragic 1.4% |
| Belgians | 0.1 /100 | #268 | Tragic 1.4% |
| Austrians | 0.1 /100 | #269 | Tragic 1.4% |
| Immigrants | North America | 0.1 /100 | #270 | Tragic 1.4% |
| Immigrants | Canada | 0.1 /100 | #271 | Tragic 1.4% |
| Blacks/African Americans | 0.1 /100 | #272 | Tragic 1.4% |
| Alaskan Athabascans | 0.1 /100 | #273 | Tragic 1.5% |
| Iroquois | 0.0 /100 | #274 | Tragic 1.5% |
| Brazilians | 0.0 /100 | #275 | Tragic 1.5% |
Demographics Similar to Fijians by Disability Age Under 5
In terms of disability age under 5, the demographic groups most similar to Fijians are Moroccan (1.2%, a difference of 0.18%), Argentinean (1.2%, a difference of 0.20%), Immigrants from Eastern Africa (1.2%, a difference of 0.27%), Immigrants from Czechoslovakia (1.2%, a difference of 0.32%), and Immigrants from Spain (1.2%, a difference of 0.36%).
| Demographics | Rating | Rank | Disability Age Under 5 |
| Immigrants | France | 88.4 /100 | #128 | Excellent 1.2% |
| Immigrants | Immigrants | 88.0 /100 | #129 | Excellent 1.2% |
| Koreans | 87.7 /100 | #130 | Excellent 1.2% |
| Immigrants | Serbia | 87.6 /100 | #131 | Excellent 1.2% |
| Immigrants | Eastern Europe | 87.3 /100 | #132 | Excellent 1.2% |
| Immigrants | Spain | 86.5 /100 | #133 | Excellent 1.2% |
| Argentineans | 85.7 /100 | #134 | Excellent 1.2% |
| Fijians | 84.7 /100 | #135 | Excellent 1.2% |
| Moroccans | 83.6 /100 | #136 | Excellent 1.2% |
| Immigrants | Eastern Africa | 83.1 /100 | #137 | Excellent 1.2% |
| Immigrants | Czechoslovakia | 82.8 /100 | #138 | Excellent 1.2% |
| New Zealanders | 81.4 /100 | #139 | Excellent 1.2% |
| Somalis | 80.8 /100 | #140 | Excellent 1.2% |
| Immigrants | Honduras | 80.4 /100 | #141 | Excellent 1.2% |
| Immigrants | Colombia | 79.3 /100 | #142 | Good 1.2% |