Belgian vs Fijian Disability Age 18 to 34
COMPARE
Belgian
Fijian
Disability Age 18 to 34
Disability Age 18 to 34 Comparison
Belgians
Fijians
7.4%
DISABILITY AGE 18 TO 34
0.1/ 100
METRIC RATING
270th/ 347
METRIC RANK
7.2%
DISABILITY AGE 18 TO 34
0.6/ 100
METRIC RATING
250th/ 347
METRIC RANK
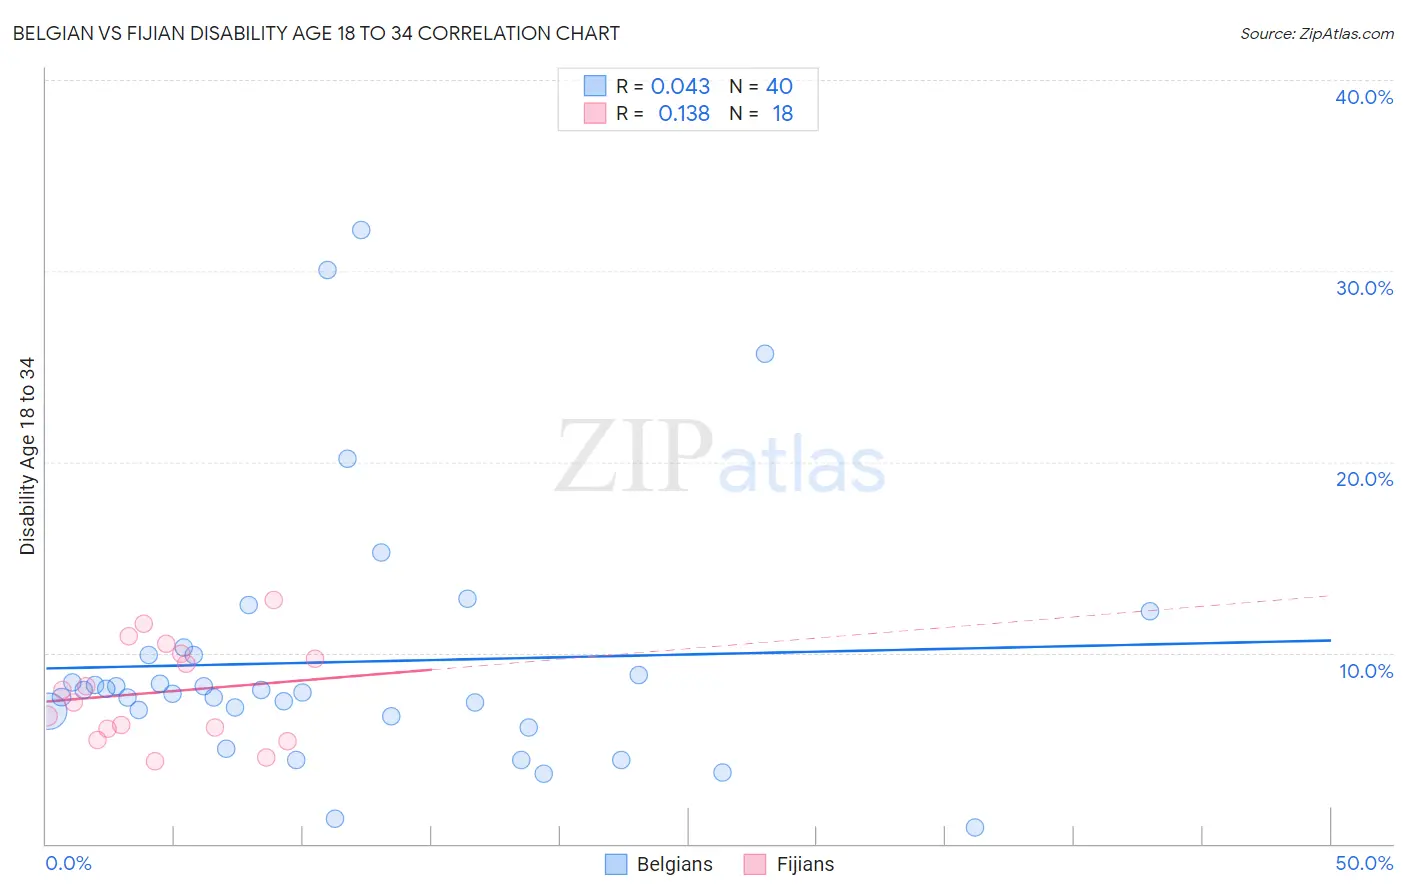
Belgian vs Fijian Disability Age 18 to 34 Correlation Chart
The statistical analysis conducted on geographies consisting of 355,052,647 people shows no correlation between the proportion of Belgians and percentage of population with a disability between the ages 18 and 35 in the United States with a correlation coefficient (R) of 0.043 and weighted average of 7.4%. Similarly, the statistical analysis conducted on geographies consisting of 55,913,538 people shows a poor positive correlation between the proportion of Fijians and percentage of population with a disability between the ages 18 and 35 in the United States with a correlation coefficient (R) of 0.138 and weighted average of 7.2%, a difference of 2.7%.
Disability Age 18 to 34 Correlation Summary
| Measurement | Belgian | Fijian |
| Minimum | 0.85% | 4.3% |
| Maximum | 32.1% | 12.8% |
| Range | 31.3% | 8.5% |
| Mean | 9.5% | 7.9% |
| Median | 8.0% | 7.7% |
| Interquartile 25% (IQ1) | 6.8% | 6.0% |
| Interquartile 75% (IQ3) | 9.9% | 10.0% |
| Interquartile Range (IQR) | 3.1% | 4.0% |
| Standard Deviation (Sample) | 6.7% | 2.5% |
| Standard Deviation (Population) | 6.6% | 2.5% |
Demographics Similar to Belgians and Fijians by Disability Age 18 to 34
In terms of disability age 18 to 34, the demographic groups most similar to Belgians are Basque (7.4%, a difference of 0.090%), Portuguese (7.4%, a difference of 0.13%), Bangladeshi (7.4%, a difference of 0.21%), German Russian (7.4%, a difference of 0.27%), and Slovene (7.3%, a difference of 0.44%). Similarly, the demographic groups most similar to Fijians are Spaniard (7.2%, a difference of 0.010%), Polish (7.2%, a difference of 0.030%), Croatian (7.2%, a difference of 0.30%), Indonesian (7.2%, a difference of 0.59%), and Immigrants from Germany (7.2%, a difference of 0.60%).
| Demographics | Rating | Rank | Disability Age 18 to 34 |
| Fijians | 0.6 /100 | #250 | Tragic 7.2% |
| Spaniards | 0.6 /100 | #251 | Tragic 7.2% |
| Poles | 0.6 /100 | #252 | Tragic 7.2% |
| Croatians | 0.5 /100 | #253 | Tragic 7.2% |
| Indonesians | 0.4 /100 | #254 | Tragic 7.2% |
| Immigrants | Germany | 0.4 /100 | #255 | Tragic 7.2% |
| Immigrants | Laos | 0.4 /100 | #256 | Tragic 7.2% |
| Czechs | 0.3 /100 | #257 | Tragic 7.2% |
| Immigrants | Micronesia | 0.3 /100 | #258 | Tragic 7.3% |
| Somalis | 0.2 /100 | #259 | Tragic 7.3% |
| Tohono O'odham | 0.2 /100 | #260 | Tragic 7.3% |
| Northern Europeans | 0.2 /100 | #261 | Tragic 7.3% |
| Canadians | 0.2 /100 | #262 | Tragic 7.3% |
| British | 0.2 /100 | #263 | Tragic 7.3% |
| Bermudans | 0.1 /100 | #264 | Tragic 7.3% |
| Slovenes | 0.1 /100 | #265 | Tragic 7.3% |
| German Russians | 0.1 /100 | #266 | Tragic 7.4% |
| Bangladeshis | 0.1 /100 | #267 | Tragic 7.4% |
| Portuguese | 0.1 /100 | #268 | Tragic 7.4% |
| Basques | 0.1 /100 | #269 | Tragic 7.4% |
| Belgians | 0.1 /100 | #270 | Tragic 7.4% |