Basque vs Comanche Male Disability
COMPARE
Basque
Comanche
Male Disability
Male Disability Comparison
Basques
Comanche
12.1%
MALE DISABILITY
0.3/ 100
METRIC RATING
258th/ 347
METRIC RANK
14.1%
MALE DISABILITY
0.0/ 100
METRIC RATING
324th/ 347
METRIC RANK
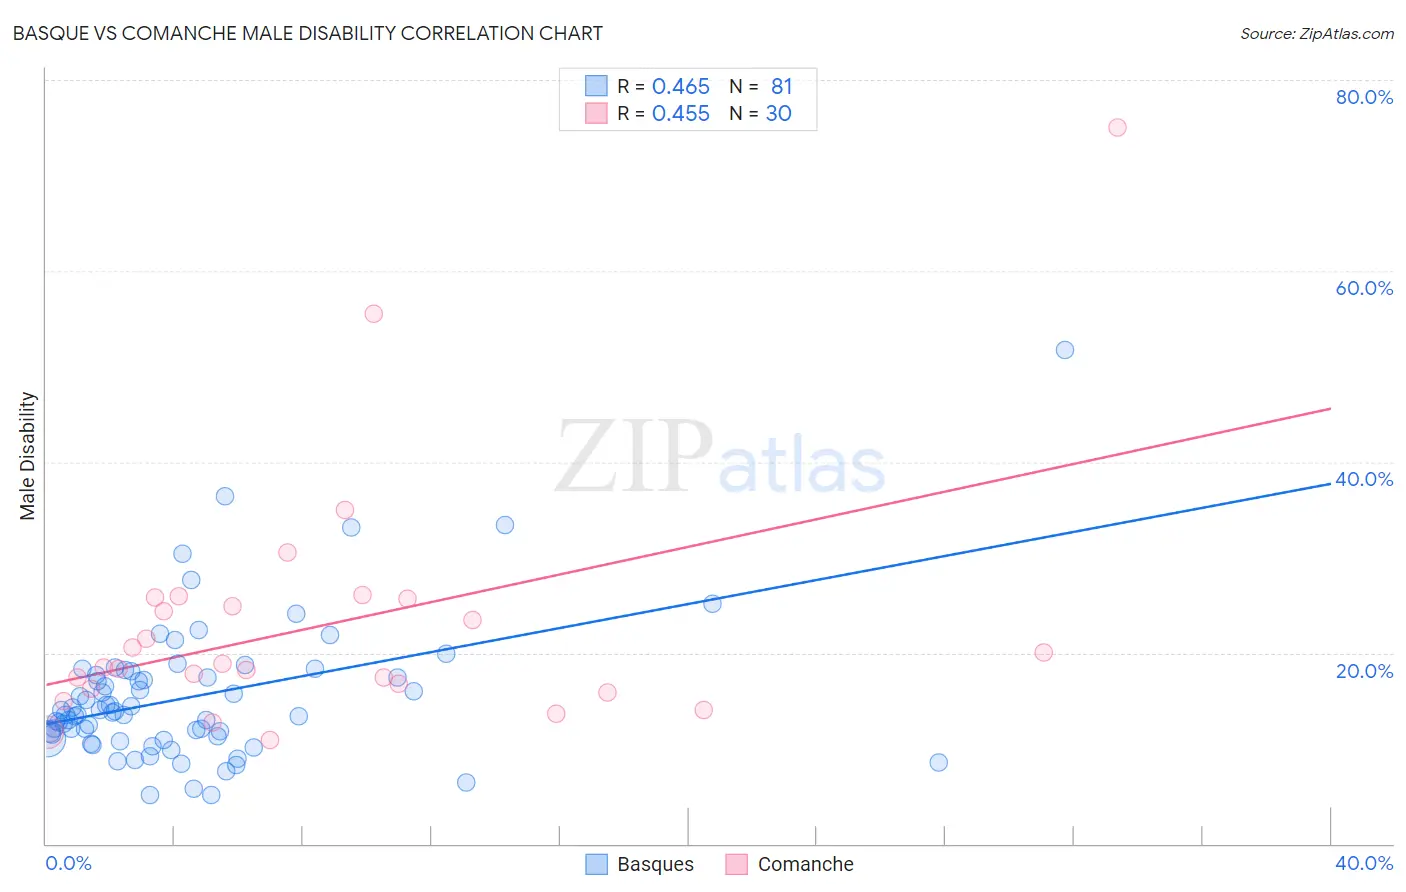
Basque vs Comanche Male Disability Correlation Chart
The statistical analysis conducted on geographies consisting of 165,777,747 people shows a moderate positive correlation between the proportion of Basques and percentage of males with a disability in the United States with a correlation coefficient (R) of 0.465 and weighted average of 12.1%. Similarly, the statistical analysis conducted on geographies consisting of 109,776,737 people shows a moderate positive correlation between the proportion of Comanche and percentage of males with a disability in the United States with a correlation coefficient (R) of 0.455 and weighted average of 14.1%, a difference of 16.0%.
Male Disability Correlation Summary
| Measurement | Basque | Comanche |
| Minimum | 5.1% | 10.8% |
| Maximum | 51.7% | 75.0% |
| Range | 46.6% | 64.2% |
| Mean | 15.4% | 22.9% |
| Median | 13.8% | 18.7% |
| Interquartile 25% (IQ1) | 11.1% | 16.2% |
| Interquartile 75% (IQ3) | 17.9% | 25.7% |
| Interquartile Range (IQR) | 6.7% | 9.5% |
| Standard Deviation (Sample) | 7.4% | 13.1% |
| Standard Deviation (Population) | 7.3% | 12.8% |
Similar Demographics by Male Disability
Demographics Similar to Basques by Male Disability
In terms of male disability, the demographic groups most similar to Basques are Belgian (12.1%, a difference of 0.040%), Swedish (12.1%, a difference of 0.12%), Swiss (12.1%, a difference of 0.19%), European (12.1%, a difference of 0.19%), and Chinese (12.1%, a difference of 0.44%).
| Demographics | Rating | Rank | Male Disability |
| German Russians | 0.5 /100 | #251 | Tragic 12.0% |
| Slovenes | 0.5 /100 | #252 | Tragic 12.0% |
| Guamanians/Chamorros | 0.5 /100 | #253 | Tragic 12.0% |
| British | 0.4 /100 | #254 | Tragic 12.1% |
| Chinese | 0.4 /100 | #255 | Tragic 12.1% |
| Swiss | 0.3 /100 | #256 | Tragic 12.1% |
| Europeans | 0.3 /100 | #257 | Tragic 12.1% |
| Basques | 0.3 /100 | #258 | Tragic 12.1% |
| Belgians | 0.3 /100 | #259 | Tragic 12.1% |
| Swedes | 0.3 /100 | #260 | Tragic 12.1% |
| Slavs | 0.2 /100 | #261 | Tragic 12.2% |
| Norwegians | 0.2 /100 | #262 | Tragic 12.2% |
| Canadians | 0.2 /100 | #263 | Tragic 12.2% |
| Nepalese | 0.2 /100 | #264 | Tragic 12.2% |
| Immigrants | Portugal | 0.1 /100 | #265 | Tragic 12.3% |
Demographics Similar to Comanche by Male Disability
In terms of male disability, the demographic groups most similar to Comanche are Ottawa (14.1%, a difference of 0.11%), Osage (14.0%, a difference of 0.33%), Apache (14.0%, a difference of 0.40%), Native/Alaskan (14.2%, a difference of 1.1%), and Potawatomi (14.2%, a difference of 1.1%).
| Demographics | Rating | Rank | Male Disability |
| Paiute | 0.0 /100 | #317 | Tragic 13.7% |
| Cree | 0.0 /100 | #318 | Tragic 13.7% |
| Americans | 0.0 /100 | #319 | Tragic 13.8% |
| Tlingit-Haida | 0.0 /100 | #320 | Tragic 13.8% |
| Shoshone | 0.0 /100 | #321 | Tragic 13.8% |
| Apache | 0.0 /100 | #322 | Tragic 14.0% |
| Osage | 0.0 /100 | #323 | Tragic 14.0% |
| Comanche | 0.0 /100 | #324 | Tragic 14.1% |
| Ottawa | 0.0 /100 | #325 | Tragic 14.1% |
| Natives/Alaskans | 0.0 /100 | #326 | Tragic 14.2% |
| Potawatomi | 0.0 /100 | #327 | Tragic 14.2% |
| Chippewa | 0.0 /100 | #328 | Tragic 14.3% |
| Cajuns | 0.0 /100 | #329 | Tragic 14.4% |
| Navajo | 0.0 /100 | #330 | Tragic 14.4% |
| Tohono O'odham | 0.0 /100 | #331 | Tragic 14.6% |