Basque vs Immigrants from Belgium Male Disability
COMPARE
Basque
Immigrants from Belgium
Male Disability
Male Disability Comparison
Basques
Immigrants from Belgium
12.1%
MALE DISABILITY
0.3/ 100
METRIC RATING
258th/ 347
METRIC RANK
10.8%
MALE DISABILITY
94.2/ 100
METRIC RATING
108th/ 347
METRIC RANK
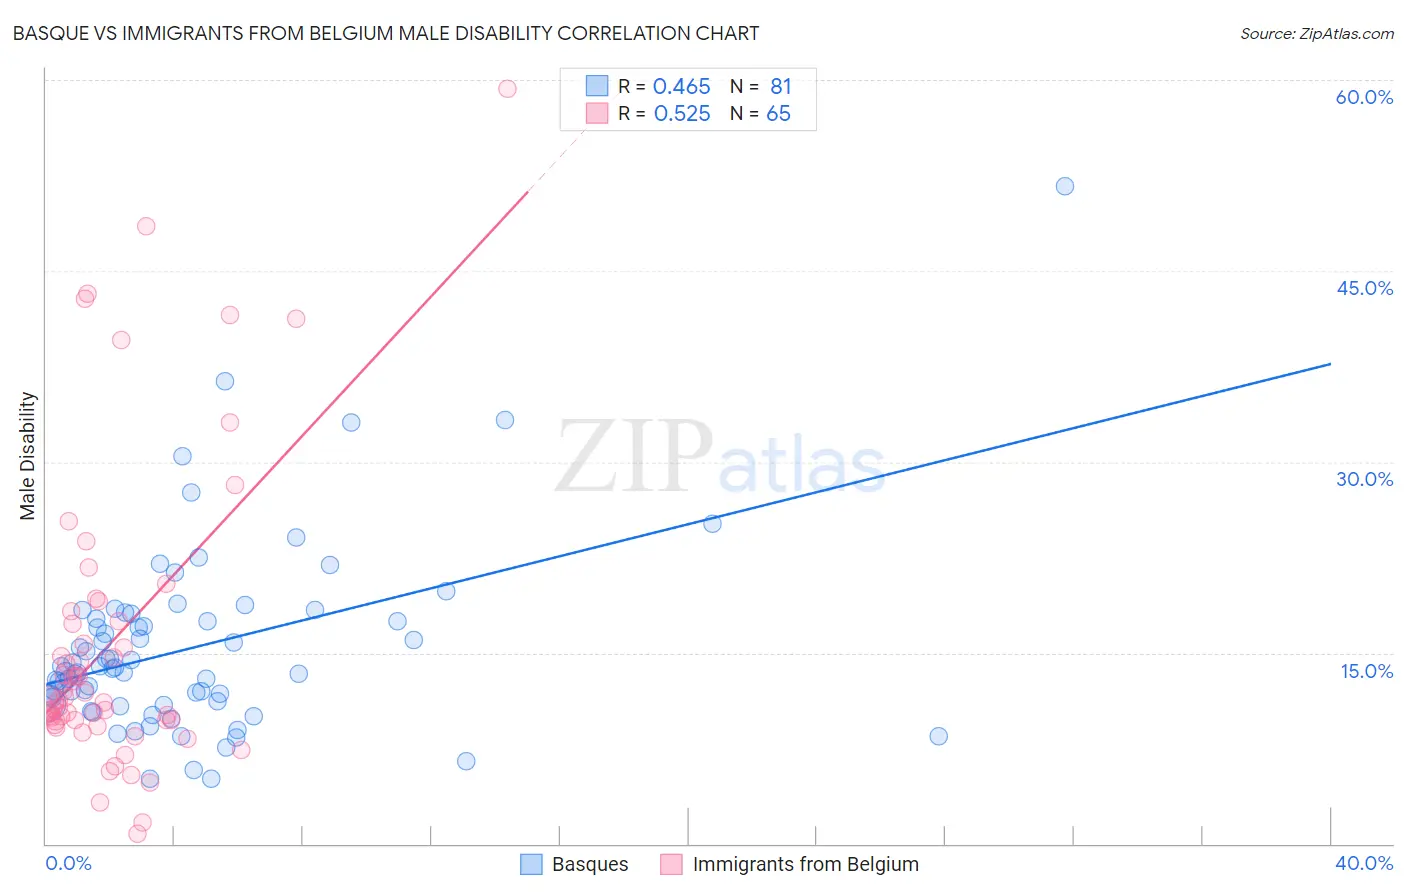
Basque vs Immigrants from Belgium Male Disability Correlation Chart
The statistical analysis conducted on geographies consisting of 165,777,747 people shows a moderate positive correlation between the proportion of Basques and percentage of males with a disability in the United States with a correlation coefficient (R) of 0.465 and weighted average of 12.1%. Similarly, the statistical analysis conducted on geographies consisting of 146,717,814 people shows a substantial positive correlation between the proportion of Immigrants from Belgium and percentage of males with a disability in the United States with a correlation coefficient (R) of 0.525 and weighted average of 10.8%, a difference of 12.4%.
Male Disability Correlation Summary
| Measurement | Basque | Immigrants from Belgium |
| Minimum | 5.1% | 0.83% |
| Maximum | 51.7% | 59.3% |
| Range | 46.6% | 58.5% |
| Mean | 15.4% | 15.9% |
| Median | 13.8% | 11.3% |
| Interquartile 25% (IQ1) | 11.1% | 9.7% |
| Interquartile 75% (IQ3) | 17.9% | 17.9% |
| Interquartile Range (IQR) | 6.7% | 8.2% |
| Standard Deviation (Sample) | 7.4% | 11.9% |
| Standard Deviation (Population) | 7.3% | 11.8% |
Similar Demographics by Male Disability
Demographics Similar to Basques by Male Disability
In terms of male disability, the demographic groups most similar to Basques are Belgian (12.1%, a difference of 0.040%), Swedish (12.1%, a difference of 0.12%), Swiss (12.1%, a difference of 0.19%), European (12.1%, a difference of 0.19%), and Chinese (12.1%, a difference of 0.44%).
| Demographics | Rating | Rank | Male Disability |
| German Russians | 0.5 /100 | #251 | Tragic 12.0% |
| Slovenes | 0.5 /100 | #252 | Tragic 12.0% |
| Guamanians/Chamorros | 0.5 /100 | #253 | Tragic 12.0% |
| British | 0.4 /100 | #254 | Tragic 12.1% |
| Chinese | 0.4 /100 | #255 | Tragic 12.1% |
| Swiss | 0.3 /100 | #256 | Tragic 12.1% |
| Europeans | 0.3 /100 | #257 | Tragic 12.1% |
| Basques | 0.3 /100 | #258 | Tragic 12.1% |
| Belgians | 0.3 /100 | #259 | Tragic 12.1% |
| Swedes | 0.3 /100 | #260 | Tragic 12.1% |
| Slavs | 0.2 /100 | #261 | Tragic 12.2% |
| Norwegians | 0.2 /100 | #262 | Tragic 12.2% |
| Canadians | 0.2 /100 | #263 | Tragic 12.2% |
| Nepalese | 0.2 /100 | #264 | Tragic 12.2% |
| Immigrants | Portugal | 0.1 /100 | #265 | Tragic 12.3% |
Demographics Similar to Immigrants from Belgium by Male Disability
In terms of male disability, the demographic groups most similar to Immigrants from Belgium are Immigrants from Eastern Africa (10.8%, a difference of 0.020%), Immigrants from Uganda (10.8%, a difference of 0.050%), Immigrants (10.8%, a difference of 0.080%), Immigrants from Uruguay (10.8%, a difference of 0.11%), and Immigrants from Syria (10.8%, a difference of 0.19%).
| Demographics | Rating | Rank | Male Disability |
| Immigrants | Greece | 95.6 /100 | #101 | Exceptional 10.7% |
| Immigrants | Eastern Europe | 95.3 /100 | #102 | Exceptional 10.7% |
| Uruguayans | 95.3 /100 | #103 | Exceptional 10.7% |
| Immigrants | Nigeria | 95.1 /100 | #104 | Exceptional 10.8% |
| Immigrants | Brazil | 95.0 /100 | #105 | Exceptional 10.8% |
| Immigrants | Syria | 94.9 /100 | #106 | Exceptional 10.8% |
| Immigrants | Eastern Africa | 94.3 /100 | #107 | Exceptional 10.8% |
| Immigrants | Belgium | 94.2 /100 | #108 | Exceptional 10.8% |
| Immigrants | Uganda | 94.0 /100 | #109 | Exceptional 10.8% |
| Immigrants | Immigrants | 93.9 /100 | #110 | Exceptional 10.8% |
| Immigrants | Uruguay | 93.8 /100 | #111 | Exceptional 10.8% |
| Ghanaians | 93.4 /100 | #112 | Exceptional 10.8% |
| Immigrants | Zimbabwe | 93.0 /100 | #113 | Exceptional 10.8% |
| Central Americans | 92.7 /100 | #114 | Exceptional 10.8% |
| Immigrants | Barbados | 92.2 /100 | #115 | Exceptional 10.8% |