Immigrants from Argentina vs Comanche Male Disability
COMPARE
Immigrants from Argentina
Comanche
Male Disability
Male Disability Comparison
Immigrants from Argentina
Comanche
10.2%
MALE DISABILITY
99.9/ 100
METRIC RATING
35th/ 347
METRIC RANK
14.1%
MALE DISABILITY
0.0/ 100
METRIC RATING
324th/ 347
METRIC RANK
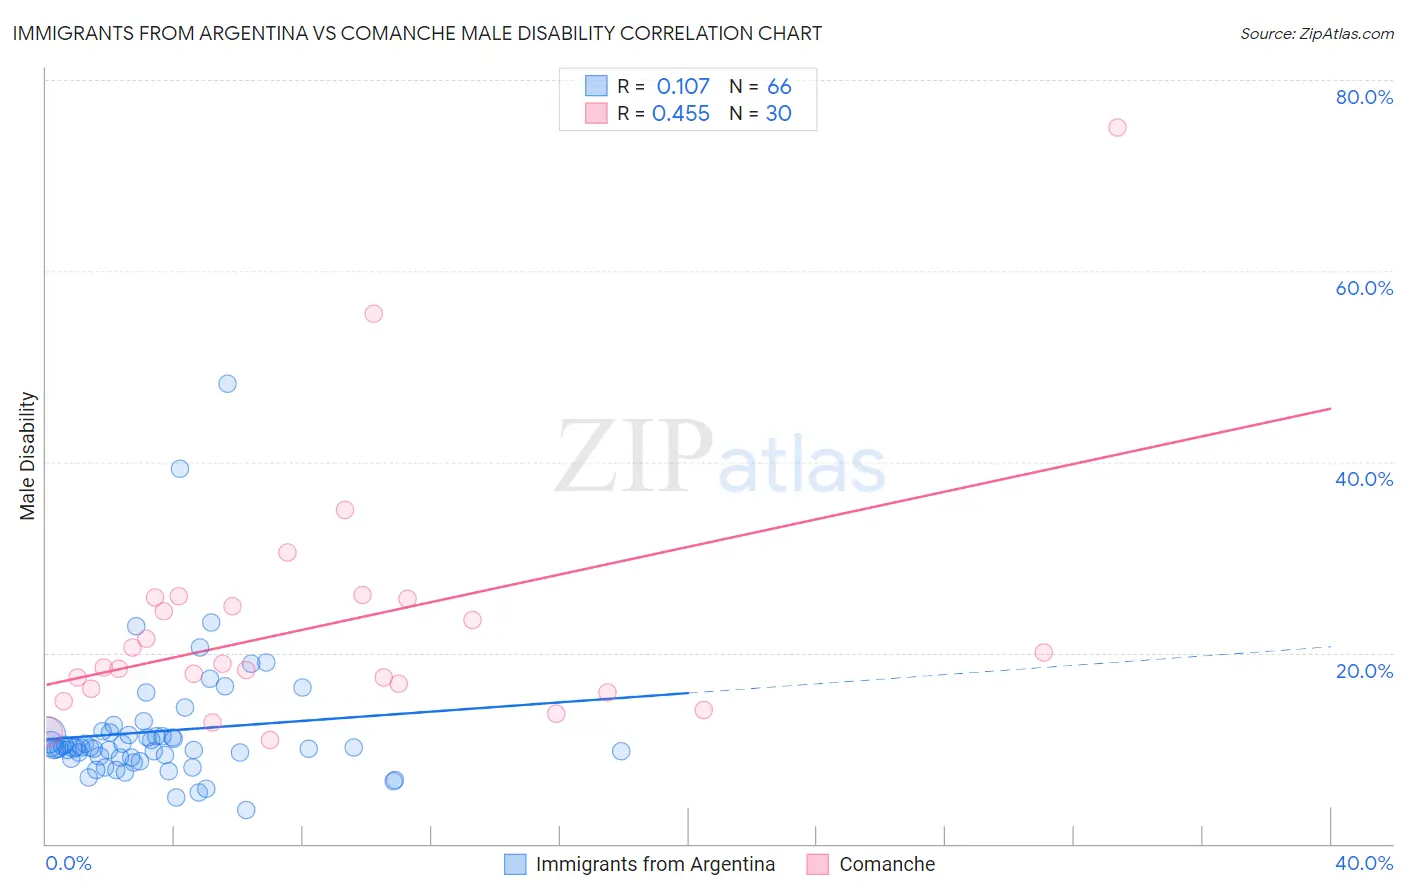
Immigrants from Argentina vs Comanche Male Disability Correlation Chart
The statistical analysis conducted on geographies consisting of 264,416,468 people shows a poor positive correlation between the proportion of Immigrants from Argentina and percentage of males with a disability in the United States with a correlation coefficient (R) of 0.107 and weighted average of 10.2%. Similarly, the statistical analysis conducted on geographies consisting of 109,776,737 people shows a moderate positive correlation between the proportion of Comanche and percentage of males with a disability in the United States with a correlation coefficient (R) of 0.455 and weighted average of 14.1%, a difference of 37.8%.
Male Disability Correlation Summary
| Measurement | Immigrants from Argentina | Comanche |
| Minimum | 3.6% | 10.8% |
| Maximum | 48.1% | 75.0% |
| Range | 44.6% | 64.2% |
| Mean | 11.8% | 22.9% |
| Median | 10.0% | 18.7% |
| Interquartile 25% (IQ1) | 9.0% | 16.2% |
| Interquartile 75% (IQ3) | 11.4% | 25.7% |
| Interquartile Range (IQR) | 2.4% | 9.5% |
| Standard Deviation (Sample) | 6.9% | 13.1% |
| Standard Deviation (Population) | 6.9% | 12.8% |
Similar Demographics by Male Disability
Demographics Similar to Immigrants from Argentina by Male Disability
In terms of male disability, the demographic groups most similar to Immigrants from Argentina are Ethiopian (10.2%, a difference of 0.050%), Immigrants from Turkey (10.2%, a difference of 0.11%), Immigrants from Indonesia (10.2%, a difference of 0.12%), Immigrants from Ethiopia (10.2%, a difference of 0.17%), and Immigrants from Kuwait (10.2%, a difference of 0.29%).
| Demographics | Rating | Rank | Male Disability |
| Vietnamese | 99.9 /100 | #28 | Exceptional 10.1% |
| Venezuelans | 99.9 /100 | #29 | Exceptional 10.1% |
| Immigrants | Egypt | 99.9 /100 | #30 | Exceptional 10.1% |
| Soviet Union | 99.9 /100 | #31 | Exceptional 10.1% |
| Argentineans | 99.9 /100 | #32 | Exceptional 10.1% |
| Immigrants | Ethiopia | 99.9 /100 | #33 | Exceptional 10.2% |
| Immigrants | Turkey | 99.9 /100 | #34 | Exceptional 10.2% |
| Immigrants | Argentina | 99.9 /100 | #35 | Exceptional 10.2% |
| Ethiopians | 99.8 /100 | #36 | Exceptional 10.2% |
| Immigrants | Indonesia | 99.8 /100 | #37 | Exceptional 10.2% |
| Immigrants | Kuwait | 99.8 /100 | #38 | Exceptional 10.2% |
| Afghans | 99.8 /100 | #39 | Exceptional 10.2% |
| Immigrants | Nepal | 99.8 /100 | #40 | Exceptional 10.3% |
| Taiwanese | 99.8 /100 | #41 | Exceptional 10.3% |
| Mongolians | 99.7 /100 | #42 | Exceptional 10.3% |
Demographics Similar to Comanche by Male Disability
In terms of male disability, the demographic groups most similar to Comanche are Ottawa (14.1%, a difference of 0.11%), Osage (14.0%, a difference of 0.33%), Apache (14.0%, a difference of 0.40%), Native/Alaskan (14.2%, a difference of 1.1%), and Potawatomi (14.2%, a difference of 1.1%).
| Demographics | Rating | Rank | Male Disability |
| Paiute | 0.0 /100 | #317 | Tragic 13.7% |
| Cree | 0.0 /100 | #318 | Tragic 13.7% |
| Americans | 0.0 /100 | #319 | Tragic 13.8% |
| Tlingit-Haida | 0.0 /100 | #320 | Tragic 13.8% |
| Shoshone | 0.0 /100 | #321 | Tragic 13.8% |
| Apache | 0.0 /100 | #322 | Tragic 14.0% |
| Osage | 0.0 /100 | #323 | Tragic 14.0% |
| Comanche | 0.0 /100 | #324 | Tragic 14.1% |
| Ottawa | 0.0 /100 | #325 | Tragic 14.1% |
| Natives/Alaskans | 0.0 /100 | #326 | Tragic 14.2% |
| Potawatomi | 0.0 /100 | #327 | Tragic 14.2% |
| Chippewa | 0.0 /100 | #328 | Tragic 14.3% |
| Cajuns | 0.0 /100 | #329 | Tragic 14.4% |
| Navajo | 0.0 /100 | #330 | Tragic 14.4% |
| Tohono O'odham | 0.0 /100 | #331 | Tragic 14.6% |