Basque vs Comanche Single Father Poverty
COMPARE
Basque
Comanche
Single Father Poverty
Single Father Poverty Comparison
Basques
Comanche
15.5%
SINGLE FATHER POVERTY
98.4/ 100
METRIC RATING
93rd/ 347
METRIC RANK
18.5%
SINGLE FATHER POVERTY
0.0/ 100
METRIC RATING
302nd/ 347
METRIC RANK
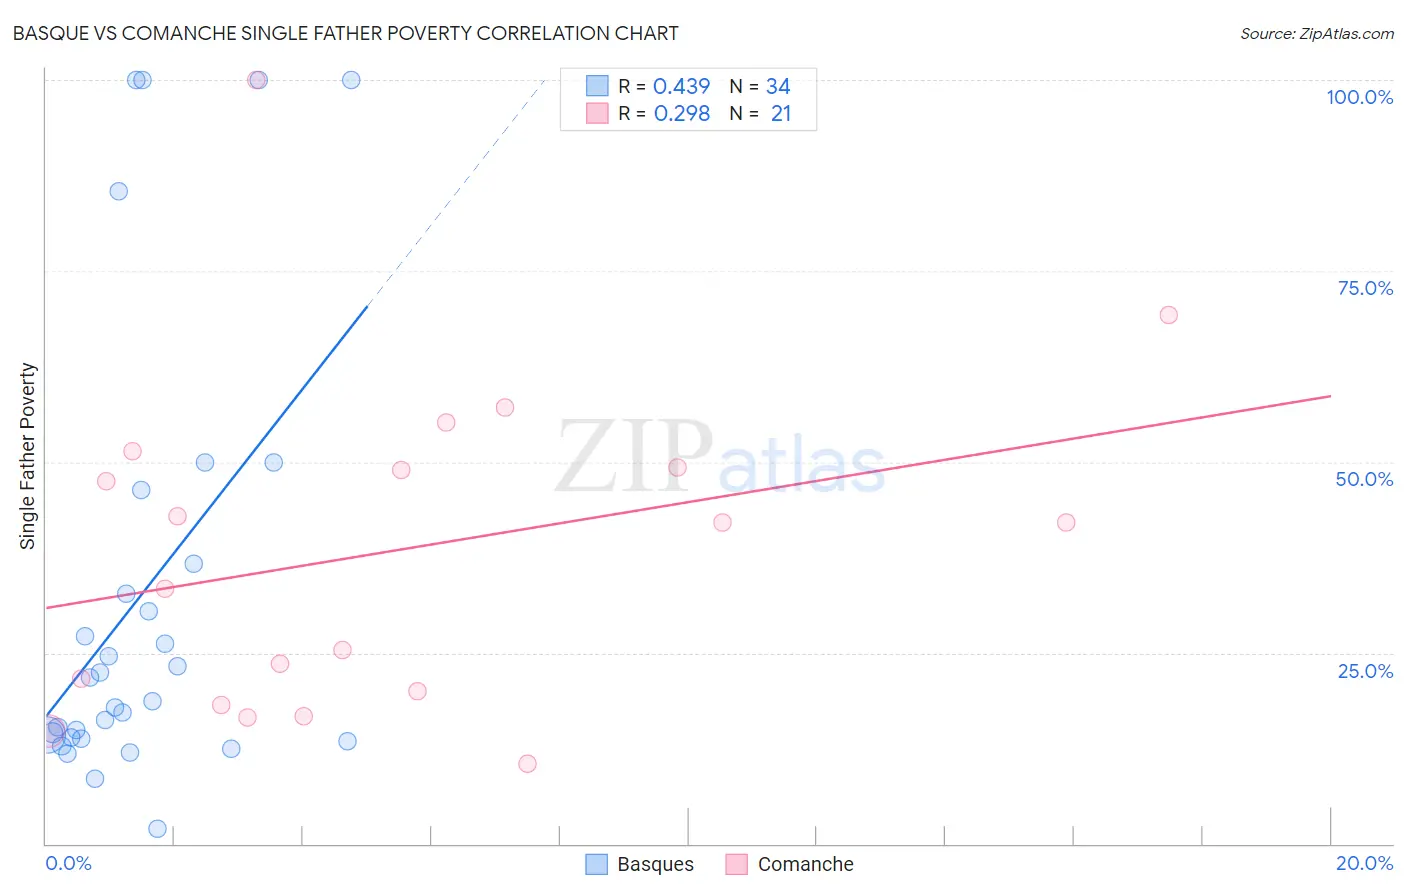
Basque vs Comanche Single Father Poverty Correlation Chart
The statistical analysis conducted on geographies consisting of 144,984,159 people shows a moderate positive correlation between the proportion of Basques and poverty level among single fathers in the United States with a correlation coefficient (R) of 0.439 and weighted average of 15.5%. Similarly, the statistical analysis conducted on geographies consisting of 100,339,334 people shows a weak positive correlation between the proportion of Comanche and poverty level among single fathers in the United States with a correlation coefficient (R) of 0.298 and weighted average of 18.5%, a difference of 18.8%.
Single Father Poverty Correlation Summary
| Measurement | Basque | Comanche |
| Minimum | 2.0% | 10.5% |
| Maximum | 100.0% | 100.0% |
| Range | 98.0% | 89.5% |
| Mean | 32.5% | 38.4% |
| Median | 20.2% | 42.1% |
| Interquartile 25% (IQ1) | 13.9% | 19.1% |
| Interquartile 75% (IQ3) | 36.7% | 50.3% |
| Interquartile Range (IQR) | 22.8% | 31.2% |
| Standard Deviation (Sample) | 29.5% | 21.9% |
| Standard Deviation (Population) | 29.0% | 21.4% |
Similar Demographics by Single Father Poverty
Demographics Similar to Basques by Single Father Poverty
In terms of single father poverty, the demographic groups most similar to Basques are Immigrants from Serbia (15.5%, a difference of 0.040%), Immigrants from Uruguay (15.6%, a difference of 0.14%), Immigrants from Romania (15.5%, a difference of 0.15%), Immigrants from Kazakhstan (15.6%, a difference of 0.19%), and Immigrants from Belgium (15.6%, a difference of 0.20%).
| Demographics | Rating | Rank | Single Father Poverty |
| Immigrants | Russia | 99.0 /100 | #86 | Exceptional 15.5% |
| Brazilians | 99.0 /100 | #87 | Exceptional 15.5% |
| Burmese | 99.0 /100 | #88 | Exceptional 15.5% |
| Immigrants | Korea | 99.0 /100 | #89 | Exceptional 15.5% |
| Mexican American Indians | 98.7 /100 | #90 | Exceptional 15.5% |
| Immigrants | Romania | 98.6 /100 | #91 | Exceptional 15.5% |
| Immigrants | Serbia | 98.5 /100 | #92 | Exceptional 15.5% |
| Basques | 98.4 /100 | #93 | Exceptional 15.5% |
| Immigrants | Uruguay | 98.2 /100 | #94 | Exceptional 15.6% |
| Immigrants | Kazakhstan | 98.2 /100 | #95 | Exceptional 15.6% |
| Immigrants | Belgium | 98.1 /100 | #96 | Exceptional 15.6% |
| Yaqui | 98.1 /100 | #97 | Exceptional 15.6% |
| Zimbabweans | 98.1 /100 | #98 | Exceptional 15.6% |
| Immigrants | Middle Africa | 97.4 /100 | #99 | Exceptional 15.6% |
| Immigrants | Chile | 96.9 /100 | #100 | Exceptional 15.7% |
Demographics Similar to Comanche by Single Father Poverty
In terms of single father poverty, the demographic groups most similar to Comanche are Celtic (18.5%, a difference of 0.040%), Hungarian (18.5%, a difference of 0.11%), Ute (18.5%, a difference of 0.18%), Blackfeet (18.5%, a difference of 0.23%), and Immigrants from Dominican Republic (18.4%, a difference of 0.32%).
| Demographics | Rating | Rank | Single Father Poverty |
| Yakama | 0.0 /100 | #295 | Tragic 18.1% |
| Seminole | 0.0 /100 | #296 | Tragic 18.1% |
| French | 0.0 /100 | #297 | Tragic 18.2% |
| Africans | 0.0 /100 | #298 | Tragic 18.3% |
| Whites/Caucasians | 0.0 /100 | #299 | Tragic 18.4% |
| Immigrants | Dominican Republic | 0.0 /100 | #300 | Tragic 18.4% |
| Hungarians | 0.0 /100 | #301 | Tragic 18.5% |
| Comanche | 0.0 /100 | #302 | Tragic 18.5% |
| Celtics | 0.0 /100 | #303 | Tragic 18.5% |
| Ute | 0.0 /100 | #304 | Tragic 18.5% |
| Blackfeet | 0.0 /100 | #305 | Tragic 18.5% |
| Scotch-Irish | 0.0 /100 | #306 | Tragic 18.6% |
| French Canadians | 0.0 /100 | #307 | Tragic 18.6% |
| Ottawa | 0.0 /100 | #308 | Tragic 18.6% |
| Immigrants | Micronesia | 0.0 /100 | #309 | Tragic 18.6% |