Immigrants from Eastern Asia vs Comanche Male Disability
COMPARE
Immigrants from Eastern Asia
Comanche
Male Disability
Male Disability Comparison
Immigrants from Eastern Asia
Comanche
9.6%
MALE DISABILITY
100.0/ 100
METRIC RATING
11th/ 347
METRIC RANK
14.1%
MALE DISABILITY
0.0/ 100
METRIC RATING
324th/ 347
METRIC RANK
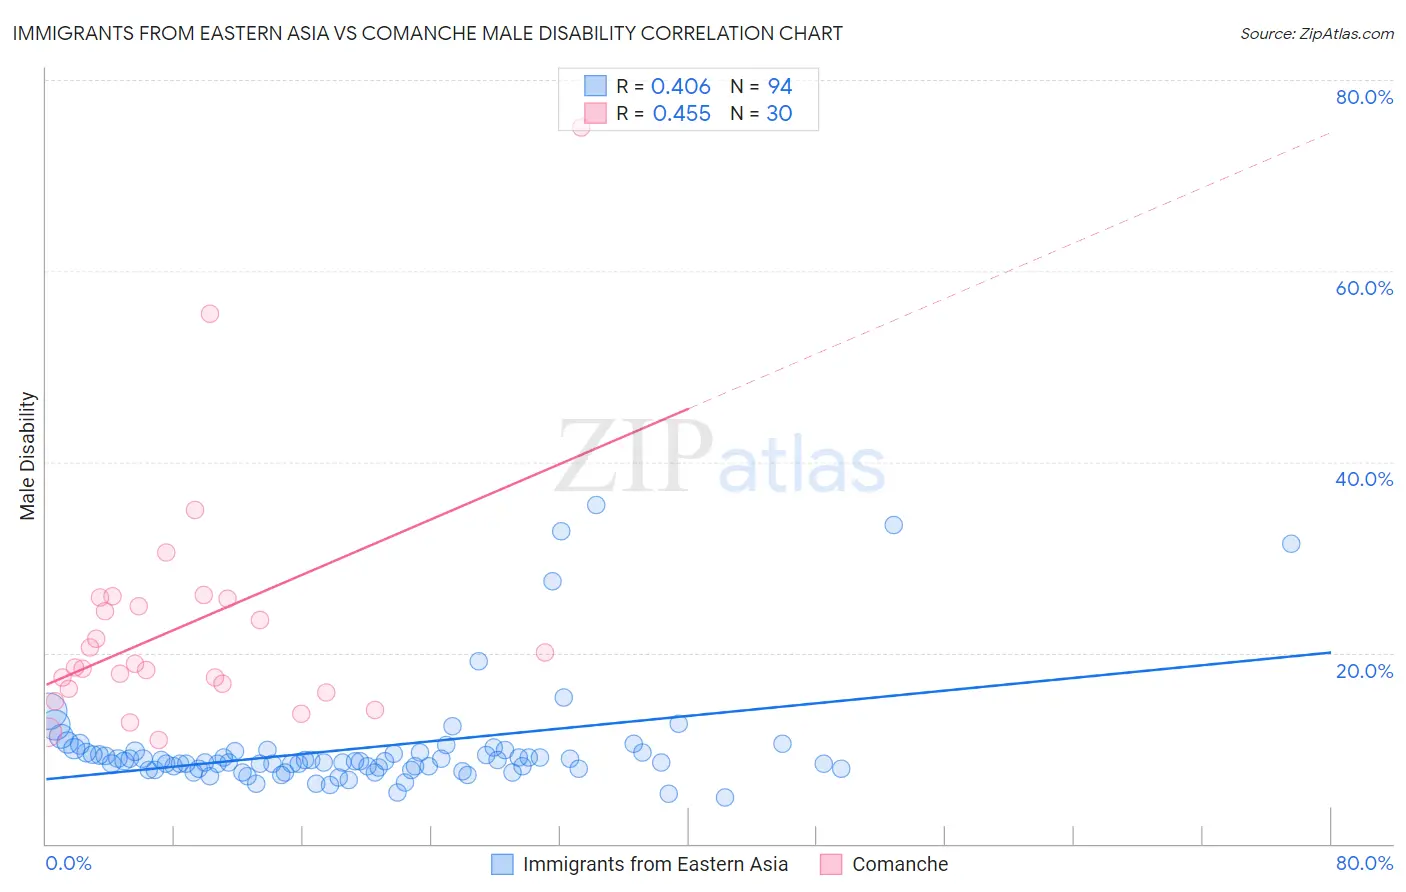
Immigrants from Eastern Asia vs Comanche Male Disability Correlation Chart
The statistical analysis conducted on geographies consisting of 499,820,999 people shows a moderate positive correlation between the proportion of Immigrants from Eastern Asia and percentage of males with a disability in the United States with a correlation coefficient (R) of 0.406 and weighted average of 9.6%. Similarly, the statistical analysis conducted on geographies consisting of 109,776,737 people shows a moderate positive correlation between the proportion of Comanche and percentage of males with a disability in the United States with a correlation coefficient (R) of 0.455 and weighted average of 14.1%, a difference of 46.1%.
Male Disability Correlation Summary
| Measurement | Immigrants from Eastern Asia | Comanche |
| Minimum | 4.9% | 10.8% |
| Maximum | 35.5% | 75.0% |
| Range | 30.6% | 64.2% |
| Mean | 10.0% | 22.9% |
| Median | 8.7% | 18.7% |
| Interquartile 25% (IQ1) | 7.9% | 16.2% |
| Interquartile 75% (IQ3) | 9.5% | 25.7% |
| Interquartile Range (IQR) | 1.6% | 9.5% |
| Standard Deviation (Sample) | 5.6% | 13.1% |
| Standard Deviation (Population) | 5.6% | 12.8% |
Similar Demographics by Male Disability
Demographics Similar to Immigrants from Eastern Asia by Male Disability
In terms of male disability, the demographic groups most similar to Immigrants from Eastern Asia are Bolivian (9.6%, a difference of 0.24%), Iranian (9.7%, a difference of 0.46%), Immigrants from Israel (9.6%, a difference of 0.55%), Immigrants from Iran (9.7%, a difference of 0.56%), and Immigrants from Singapore (9.5%, a difference of 0.98%).
| Demographics | Rating | Rank | Male Disability |
| Thais | 100.0 /100 | #4 | Exceptional 9.2% |
| Immigrants | Hong Kong | 100.0 /100 | #5 | Exceptional 9.4% |
| Immigrants | South Central Asia | 100.0 /100 | #6 | Exceptional 9.4% |
| Immigrants | Bolivia | 100.0 /100 | #7 | Exceptional 9.5% |
| Immigrants | China | 100.0 /100 | #8 | Exceptional 9.5% |
| Immigrants | Singapore | 100.0 /100 | #9 | Exceptional 9.5% |
| Immigrants | Israel | 100.0 /100 | #10 | Exceptional 9.6% |
| Immigrants | Eastern Asia | 100.0 /100 | #11 | Exceptional 9.6% |
| Bolivians | 100.0 /100 | #12 | Exceptional 9.6% |
| Iranians | 100.0 /100 | #13 | Exceptional 9.7% |
| Immigrants | Iran | 100.0 /100 | #14 | Exceptional 9.7% |
| Indians (Asian) | 100.0 /100 | #15 | Exceptional 9.7% |
| Okinawans | 100.0 /100 | #16 | Exceptional 9.8% |
| Immigrants | Korea | 100.0 /100 | #17 | Exceptional 9.8% |
| Immigrants | Pakistan | 100.0 /100 | #18 | Exceptional 9.8% |
Demographics Similar to Comanche by Male Disability
In terms of male disability, the demographic groups most similar to Comanche are Ottawa (14.1%, a difference of 0.11%), Osage (14.0%, a difference of 0.33%), Apache (14.0%, a difference of 0.40%), Native/Alaskan (14.2%, a difference of 1.1%), and Potawatomi (14.2%, a difference of 1.1%).
| Demographics | Rating | Rank | Male Disability |
| Paiute | 0.0 /100 | #317 | Tragic 13.7% |
| Cree | 0.0 /100 | #318 | Tragic 13.7% |
| Americans | 0.0 /100 | #319 | Tragic 13.8% |
| Tlingit-Haida | 0.0 /100 | #320 | Tragic 13.8% |
| Shoshone | 0.0 /100 | #321 | Tragic 13.8% |
| Apache | 0.0 /100 | #322 | Tragic 14.0% |
| Osage | 0.0 /100 | #323 | Tragic 14.0% |
| Comanche | 0.0 /100 | #324 | Tragic 14.1% |
| Ottawa | 0.0 /100 | #325 | Tragic 14.1% |
| Natives/Alaskans | 0.0 /100 | #326 | Tragic 14.2% |
| Potawatomi | 0.0 /100 | #327 | Tragic 14.2% |
| Chippewa | 0.0 /100 | #328 | Tragic 14.3% |
| Cajuns | 0.0 /100 | #329 | Tragic 14.4% |
| Navajo | 0.0 /100 | #330 | Tragic 14.4% |
| Tohono O'odham | 0.0 /100 | #331 | Tragic 14.6% |