Salvadoran vs Comanche Male Disability
COMPARE
Salvadoran
Comanche
Male Disability
Male Disability Comparison
Salvadorans
Comanche
10.4%
MALE DISABILITY
99.6/ 100
METRIC RATING
51st/ 347
METRIC RANK
14.1%
MALE DISABILITY
0.0/ 100
METRIC RATING
324th/ 347
METRIC RANK
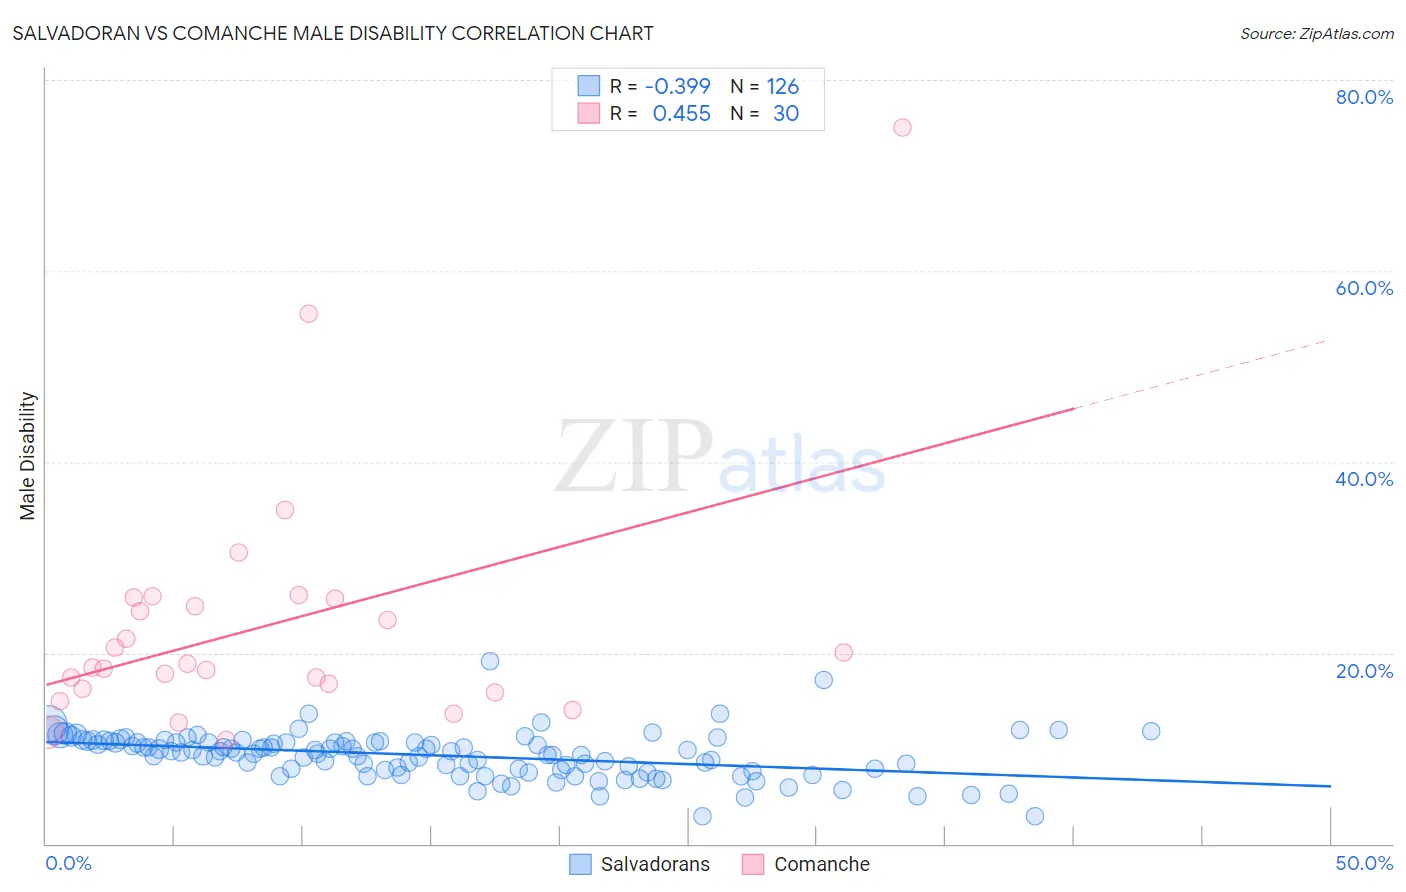
Salvadoran vs Comanche Male Disability Correlation Chart
The statistical analysis conducted on geographies consisting of 398,921,058 people shows a mild negative correlation between the proportion of Salvadorans and percentage of males with a disability in the United States with a correlation coefficient (R) of -0.399 and weighted average of 10.4%. Similarly, the statistical analysis conducted on geographies consisting of 109,776,737 people shows a moderate positive correlation between the proportion of Comanche and percentage of males with a disability in the United States with a correlation coefficient (R) of 0.455 and weighted average of 14.1%, a difference of 35.7%.
Male Disability Correlation Summary
| Measurement | Salvadoran | Comanche |
| Minimum | 2.9% | 10.8% |
| Maximum | 19.1% | 75.0% |
| Range | 16.2% | 64.2% |
| Mean | 9.3% | 22.9% |
| Median | 9.6% | 18.7% |
| Interquartile 25% (IQ1) | 7.7% | 16.2% |
| Interquartile 75% (IQ3) | 10.6% | 25.7% |
| Interquartile Range (IQR) | 2.9% | 9.5% |
| Standard Deviation (Sample) | 2.4% | 13.1% |
| Standard Deviation (Population) | 2.3% | 12.8% |
Similar Demographics by Male Disability
Demographics Similar to Salvadorans by Male Disability
In terms of male disability, the demographic groups most similar to Salvadorans are Immigrants from Saudi Arabia (10.4%, a difference of 0.020%), Immigrants from Uzbekistan (10.4%, a difference of 0.040%), Peruvian (10.4%, a difference of 0.080%), Immigrants from Eritrea (10.4%, a difference of 0.10%), and Tongan (10.4%, a difference of 0.14%).
| Demographics | Rating | Rank | Male Disability |
| Immigrants | El Salvador | 99.7 /100 | #44 | Exceptional 10.3% |
| Turks | 99.7 /100 | #45 | Exceptional 10.3% |
| Cambodians | 99.7 /100 | #46 | Exceptional 10.3% |
| Immigrants | Peru | 99.7 /100 | #47 | Exceptional 10.3% |
| Israelis | 99.7 /100 | #48 | Exceptional 10.3% |
| Immigrants | Spain | 99.7 /100 | #49 | Exceptional 10.3% |
| South Americans | 99.6 /100 | #50 | Exceptional 10.3% |
| Salvadorans | 99.6 /100 | #51 | Exceptional 10.4% |
| Immigrants | Saudi Arabia | 99.6 /100 | #52 | Exceptional 10.4% |
| Immigrants | Uzbekistan | 99.6 /100 | #53 | Exceptional 10.4% |
| Peruvians | 99.6 /100 | #54 | Exceptional 10.4% |
| Immigrants | Eritrea | 99.6 /100 | #55 | Exceptional 10.4% |
| Tongans | 99.6 /100 | #56 | Exceptional 10.4% |
| Immigrants | South America | 99.6 /100 | #57 | Exceptional 10.4% |
| Immigrants | Japan | 99.5 /100 | #58 | Exceptional 10.4% |
Demographics Similar to Comanche by Male Disability
In terms of male disability, the demographic groups most similar to Comanche are Ottawa (14.1%, a difference of 0.11%), Osage (14.0%, a difference of 0.33%), Apache (14.0%, a difference of 0.40%), Native/Alaskan (14.2%, a difference of 1.1%), and Potawatomi (14.2%, a difference of 1.1%).
| Demographics | Rating | Rank | Male Disability |
| Paiute | 0.0 /100 | #317 | Tragic 13.7% |
| Cree | 0.0 /100 | #318 | Tragic 13.7% |
| Americans | 0.0 /100 | #319 | Tragic 13.8% |
| Tlingit-Haida | 0.0 /100 | #320 | Tragic 13.8% |
| Shoshone | 0.0 /100 | #321 | Tragic 13.8% |
| Apache | 0.0 /100 | #322 | Tragic 14.0% |
| Osage | 0.0 /100 | #323 | Tragic 14.0% |
| Comanche | 0.0 /100 | #324 | Tragic 14.1% |
| Ottawa | 0.0 /100 | #325 | Tragic 14.1% |
| Natives/Alaskans | 0.0 /100 | #326 | Tragic 14.2% |
| Potawatomi | 0.0 /100 | #327 | Tragic 14.2% |
| Chippewa | 0.0 /100 | #328 | Tragic 14.3% |
| Cajuns | 0.0 /100 | #329 | Tragic 14.4% |
| Navajo | 0.0 /100 | #330 | Tragic 14.4% |
| Tohono O'odham | 0.0 /100 | #331 | Tragic 14.6% |