Barbadian vs Jamaican College, 1 year or more
COMPARE
Barbadian
Jamaican
College, 1 year or more
College, 1 year or more Comparison
Barbadians
Jamaicans
56.0%
COLLEGE, 1 YEAR OR MORE
1.3/ 100
METRIC RATING
238th/ 347
METRIC RANK
54.9%
COLLEGE, 1 YEAR OR MORE
0.3/ 100
METRIC RATING
260th/ 347
METRIC RANK
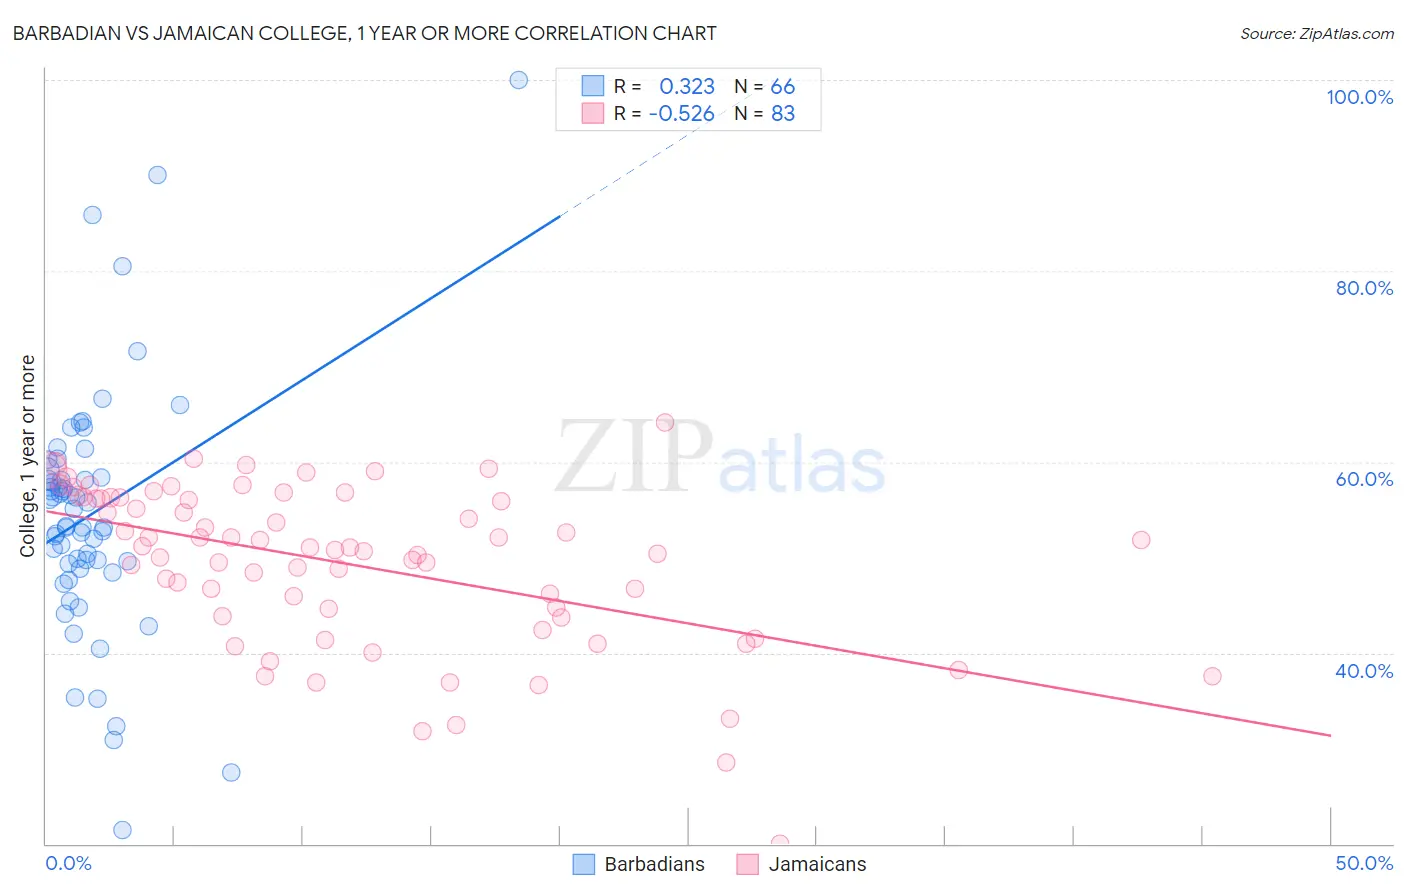
Barbadian vs Jamaican College, 1 year or more Correlation Chart
The statistical analysis conducted on geographies consisting of 141,304,122 people shows a mild positive correlation between the proportion of Barbadians and percentage of population with at least college, 1 year or more education in the United States with a correlation coefficient (R) of 0.323 and weighted average of 56.0%. Similarly, the statistical analysis conducted on geographies consisting of 368,077,485 people shows a substantial negative correlation between the proportion of Jamaicans and percentage of population with at least college, 1 year or more education in the United States with a correlation coefficient (R) of -0.526 and weighted average of 54.9%, a difference of 2.1%.
College, 1 year or more Correlation Summary
| Measurement | Barbadian | Jamaican |
| Minimum | 21.4% | 20.1% |
| Maximum | 100.0% | 64.1% |
| Range | 78.6% | 44.0% |
| Mean | 54.5% | 49.3% |
| Median | 54.2% | 51.0% |
| Interquartile 25% (IQ1) | 49.4% | 43.8% |
| Interquartile 75% (IQ3) | 58.3% | 56.2% |
| Interquartile Range (IQR) | 8.9% | 12.4% |
| Standard Deviation (Sample) | 13.0% | 8.5% |
| Standard Deviation (Population) | 12.9% | 8.4% |
Similar Demographics by College, 1 year or more
Demographics Similar to Barbadians by College, 1 year or more
In terms of college, 1 year or more, the demographic groups most similar to Barbadians are Puget Sound Salish (55.9%, a difference of 0.20%), Samoan (56.2%, a difference of 0.27%), Trinidadian and Tobagonian (55.8%, a difference of 0.30%), French American Indian (55.8%, a difference of 0.34%), and Iroquois (56.2%, a difference of 0.38%).
| Demographics | Rating | Rank | College, 1 year or more |
| Immigrants | Burma/Myanmar | 2.7 /100 | #231 | Tragic 56.6% |
| Immigrants | Bangladesh | 2.6 /100 | #232 | Tragic 56.6% |
| Immigrants | Nonimmigrants | 2.5 /100 | #233 | Tragic 56.5% |
| Spanish Americans | 1.8 /100 | #234 | Tragic 56.3% |
| West Indians | 1.8 /100 | #235 | Tragic 56.3% |
| Iroquois | 1.7 /100 | #236 | Tragic 56.2% |
| Samoans | 1.6 /100 | #237 | Tragic 56.2% |
| Barbadians | 1.3 /100 | #238 | Tragic 56.0% |
| Puget Sound Salish | 1.1 /100 | #239 | Tragic 55.9% |
| Trinidadians and Tobagonians | 1.1 /100 | #240 | Tragic 55.8% |
| French American Indians | 1.0 /100 | #241 | Tragic 55.8% |
| Marshallese | 1.0 /100 | #242 | Tragic 55.8% |
| Osage | 1.0 /100 | #243 | Tragic 55.8% |
| Chippewa | 0.9 /100 | #244 | Tragic 55.7% |
| Immigrants | Liberia | 0.8 /100 | #245 | Tragic 55.7% |
Demographics Similar to Jamaicans by College, 1 year or more
In terms of college, 1 year or more, the demographic groups most similar to Jamaicans are Ottawa (54.9%, a difference of 0.030%), Nepalese (54.9%, a difference of 0.10%), Immigrants from St. Vincent and the Grenadines (54.8%, a difference of 0.11%), U.S. Virgin Islander (54.8%, a difference of 0.13%), and African (55.0%, a difference of 0.16%).
| Demographics | Rating | Rank | College, 1 year or more |
| Immigrants | Barbados | 0.6 /100 | #253 | Tragic 55.4% |
| Japanese | 0.5 /100 | #254 | Tragic 55.2% |
| Immigrants | Bahamas | 0.5 /100 | #255 | Tragic 55.2% |
| Immigrants | West Indies | 0.5 /100 | #256 | Tragic 55.2% |
| Indonesians | 0.4 /100 | #257 | Tragic 55.1% |
| Africans | 0.4 /100 | #258 | Tragic 55.0% |
| Nepalese | 0.3 /100 | #259 | Tragic 54.9% |
| Jamaicans | 0.3 /100 | #260 | Tragic 54.9% |
| Ottawa | 0.3 /100 | #261 | Tragic 54.9% |
| Immigrants | St. Vincent and the Grenadines | 0.3 /100 | #262 | Tragic 54.8% |
| U.S. Virgin Islanders | 0.3 /100 | #263 | Tragic 54.8% |
| Immigrants | Micronesia | 0.3 /100 | #264 | Tragic 54.8% |
| Immigrants | Laos | 0.2 /100 | #265 | Tragic 54.7% |
| Potawatomi | 0.2 /100 | #266 | Tragic 54.6% |
| Blackfeet | 0.2 /100 | #267 | Tragic 54.6% |