Brazilian vs Immigrants from Spain Hearing Disability
COMPARE
Brazilian
Immigrants from Spain
Hearing Disability
Hearing Disability Comparison
Brazilians
Immigrants from Spain
2.9%
HEARING DISABILITY
78.7/ 100
METRIC RATING
146th/ 347
METRIC RANK
2.8%
HEARING DISABILITY
94.9/ 100
METRIC RATING
101st/ 347
METRIC RANK
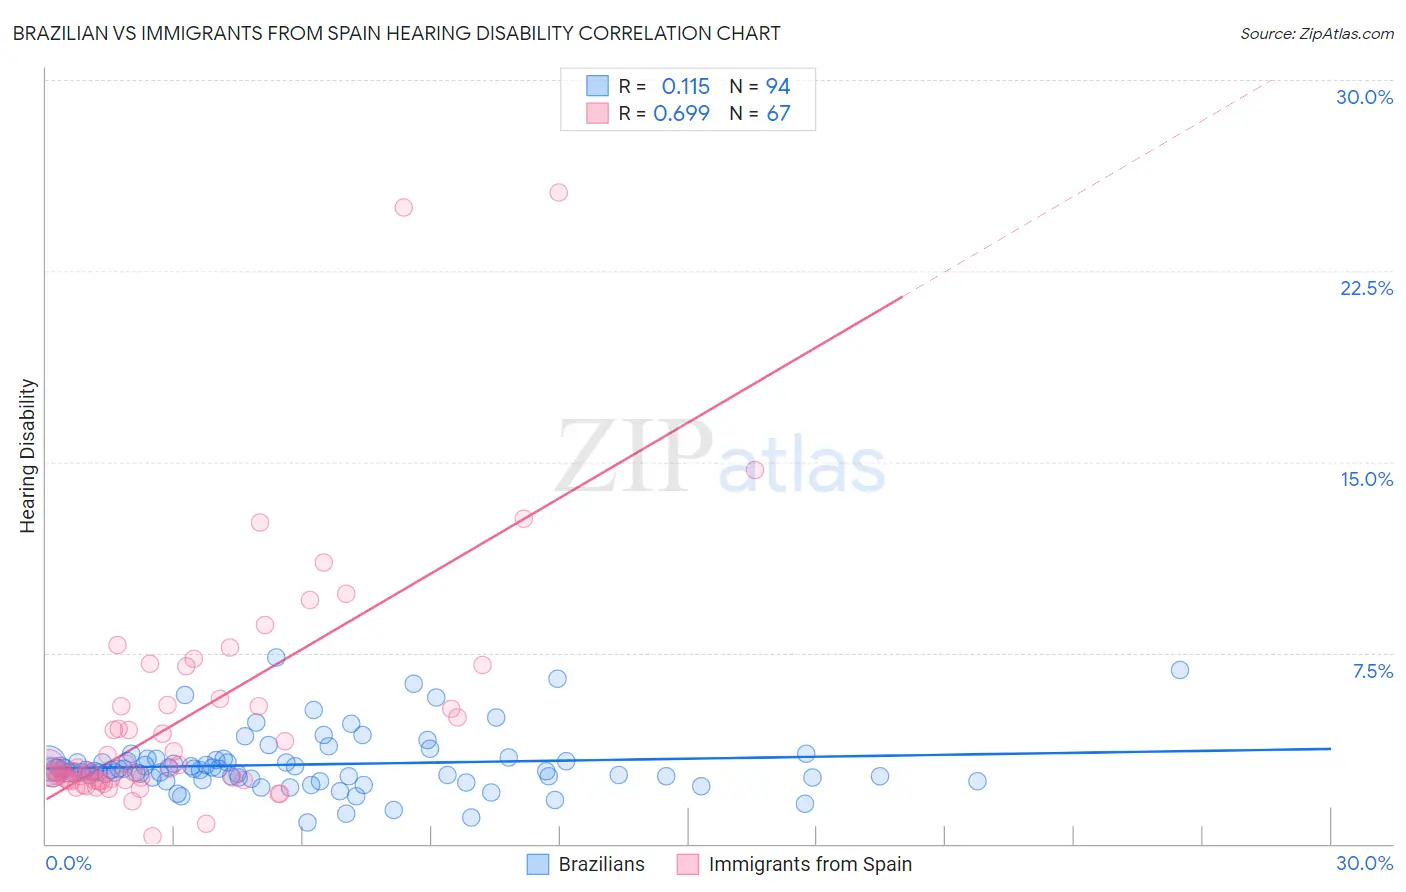
Brazilian vs Immigrants from Spain Hearing Disability Correlation Chart
The statistical analysis conducted on geographies consisting of 323,867,149 people shows a poor positive correlation between the proportion of Brazilians and percentage of population with hearing disability in the United States with a correlation coefficient (R) of 0.115 and weighted average of 2.9%. Similarly, the statistical analysis conducted on geographies consisting of 239,646,131 people shows a significant positive correlation between the proportion of Immigrants from Spain and percentage of population with hearing disability in the United States with a correlation coefficient (R) of 0.699 and weighted average of 2.8%, a difference of 4.1%.
Hearing Disability Correlation Summary
| Measurement | Brazilian | Immigrants from Spain |
| Minimum | 0.82% | 0.32% |
| Maximum | 7.3% | 25.6% |
| Range | 6.5% | 25.3% |
| Mean | 3.1% | 4.9% |
| Median | 2.9% | 2.9% |
| Interquartile 25% (IQ1) | 2.6% | 2.5% |
| Interquartile 75% (IQ3) | 3.3% | 5.4% |
| Interquartile Range (IQR) | 0.65% | 2.9% |
| Standard Deviation (Sample) | 1.2% | 4.7% |
| Standard Deviation (Population) | 1.2% | 4.6% |
Similar Demographics by Hearing Disability
Demographics Similar to Brazilians by Hearing Disability
In terms of hearing disability, the demographic groups most similar to Brazilians are Tongan (2.9%, a difference of 0.010%), Immigrants from Congo (2.9%, a difference of 0.020%), Immigrants from Bulgaria (2.9%, a difference of 0.070%), Immigrants from Russia (2.9%, a difference of 0.15%), and Immigrants from Panama (2.9%, a difference of 0.26%).
| Demographics | Rating | Rank | Hearing Disability |
| Bermudans | 83.8 /100 | #139 | Excellent 2.9% |
| Immigrants | Jordan | 83.7 /100 | #140 | Excellent 2.9% |
| Sub-Saharan Africans | 83.3 /100 | #141 | Excellent 2.9% |
| Laotians | 81.1 /100 | #142 | Excellent 2.9% |
| Immigrants | Bahamas | 80.9 /100 | #143 | Excellent 2.9% |
| Immigrants | Bulgaria | 79.2 /100 | #144 | Good 2.9% |
| Immigrants | Congo | 78.9 /100 | #145 | Good 2.9% |
| Brazilians | 78.7 /100 | #146 | Good 2.9% |
| Tongans | 78.6 /100 | #147 | Good 2.9% |
| Immigrants | Russia | 77.7 /100 | #148 | Good 2.9% |
| Immigrants | Panama | 76.9 /100 | #149 | Good 2.9% |
| Palestinians | 73.6 /100 | #150 | Good 2.9% |
| Immigrants | France | 73.1 /100 | #151 | Good 2.9% |
| Immigrants | Lithuania | 73.0 /100 | #152 | Good 2.9% |
| Sudanese | 72.1 /100 | #153 | Good 2.9% |
Demographics Similar to Immigrants from Spain by Hearing Disability
In terms of hearing disability, the demographic groups most similar to Immigrants from Spain are Taiwanese (2.8%, a difference of 0.010%), Immigrants from Eastern Africa (2.8%, a difference of 0.050%), Immigrants from Indonesia (2.8%, a difference of 0.060%), Immigrants from Guatemala (2.8%, a difference of 0.11%), and Immigrants from Honduras (2.8%, a difference of 0.15%).
| Demographics | Rating | Rank | Hearing Disability |
| Uruguayans | 95.9 /100 | #94 | Exceptional 2.8% |
| Israelis | 95.9 /100 | #95 | Exceptional 2.8% |
| Immigrants | Somalia | 95.5 /100 | #96 | Exceptional 2.8% |
| Immigrants | Afghanistan | 95.3 /100 | #97 | Exceptional 2.8% |
| Immigrants | Honduras | 95.1 /100 | #98 | Exceptional 2.8% |
| Immigrants | Guatemala | 95.1 /100 | #99 | Exceptional 2.8% |
| Immigrants | Eastern Africa | 95.0 /100 | #100 | Exceptional 2.8% |
| Immigrants | Spain | 94.9 /100 | #101 | Exceptional 2.8% |
| Taiwanese | 94.8 /100 | #102 | Exceptional 2.8% |
| Immigrants | Indonesia | 94.7 /100 | #103 | Exceptional 2.8% |
| Burmese | 94.2 /100 | #104 | Exceptional 2.8% |
| Moroccans | 93.9 /100 | #105 | Exceptional 2.8% |
| Hondurans | 93.4 /100 | #106 | Exceptional 2.8% |
| Immigrants | Chile | 93.4 /100 | #107 | Exceptional 2.8% |
| Guatemalans | 93.2 /100 | #108 | Exceptional 2.8% |