Barbadian vs Immigrants from Spain Master's Degree
COMPARE
Barbadian
Immigrants from Spain
Master's Degree
Master's Degree Comparison
Barbadians
Immigrants from Spain
14.7%
MASTER'S DEGREE
38.3/ 100
METRIC RATING
185th/ 347
METRIC RANK
19.1%
MASTER'S DEGREE
100.0/ 100
METRIC RATING
39th/ 347
METRIC RANK
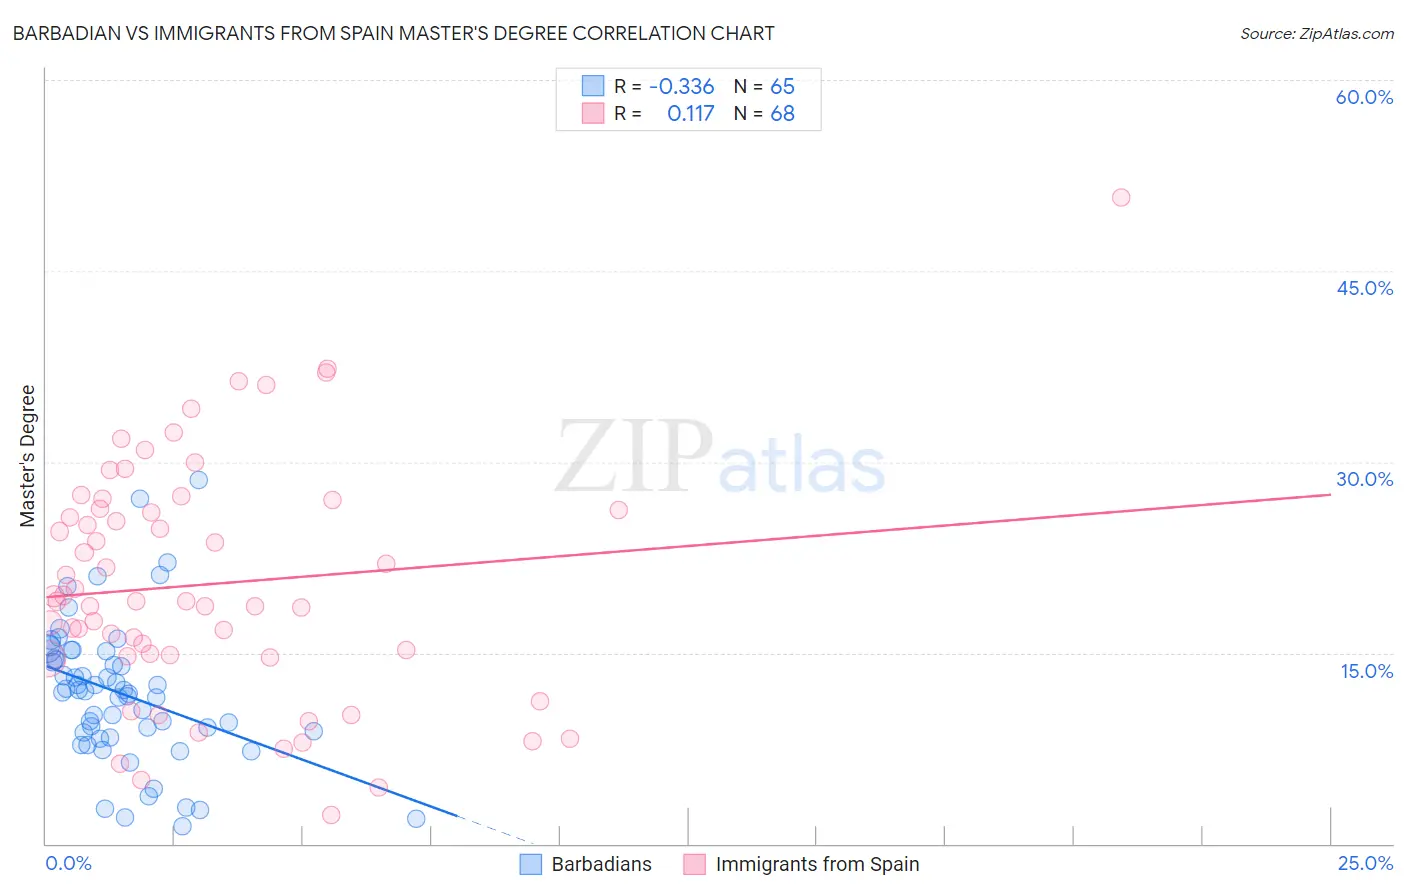
Barbadian vs Immigrants from Spain Master's Degree Correlation Chart
The statistical analysis conducted on geographies consisting of 141,295,257 people shows a mild negative correlation between the proportion of Barbadians and percentage of population with at least master's degree education in the United States with a correlation coefficient (R) of -0.336 and weighted average of 14.7%. Similarly, the statistical analysis conducted on geographies consisting of 239,658,516 people shows a poor positive correlation between the proportion of Immigrants from Spain and percentage of population with at least master's degree education in the United States with a correlation coefficient (R) of 0.117 and weighted average of 19.1%, a difference of 30.3%.
Master's Degree Correlation Summary
| Measurement | Barbadian | Immigrants from Spain |
| Minimum | 1.3% | 2.2% |
| Maximum | 28.6% | 50.8% |
| Range | 27.2% | 48.5% |
| Mean | 11.8% | 20.4% |
| Median | 12.0% | 19.0% |
| Interquartile 25% (IQ1) | 8.6% | 14.8% |
| Interquartile 75% (IQ3) | 14.8% | 26.3% |
| Interquartile Range (IQR) | 6.3% | 11.5% |
| Standard Deviation (Sample) | 5.5% | 9.3% |
| Standard Deviation (Population) | 5.5% | 9.3% |
Similar Demographics by Master's Degree
Demographics Similar to Barbadians by Master's Degree
In terms of master's degree, the demographic groups most similar to Barbadians are Immigrants from Zaire (14.7%, a difference of 0.16%), Immigrants from Oceania (14.7%, a difference of 0.16%), Sri Lankan (14.7%, a difference of 0.18%), Basque (14.7%, a difference of 0.24%), and Czech (14.7%, a difference of 0.28%).
| Demographics | Rating | Rank | Master's Degree |
| English | 45.0 /100 | #178 | Average 14.8% |
| Immigrants | Iraq | 41.3 /100 | #179 | Average 14.8% |
| Celtics | 41.3 /100 | #180 | Average 14.8% |
| Swiss | 41.1 /100 | #181 | Average 14.7% |
| Czechs | 40.4 /100 | #182 | Average 14.7% |
| Sri Lankans | 39.6 /100 | #183 | Fair 14.7% |
| Immigrants | Zaire | 39.5 /100 | #184 | Fair 14.7% |
| Barbadians | 38.3 /100 | #185 | Fair 14.7% |
| Immigrants | Oceania | 37.1 /100 | #186 | Fair 14.7% |
| Basques | 36.5 /100 | #187 | Fair 14.7% |
| Immigrants | Costa Rica | 36.2 /100 | #188 | Fair 14.7% |
| Immigrants | Immigrants | 36.0 /100 | #189 | Fair 14.6% |
| Spaniards | 35.8 /100 | #190 | Fair 14.6% |
| Welsh | 34.2 /100 | #191 | Fair 14.6% |
| Immigrants | Middle Africa | 33.6 /100 | #192 | Fair 14.6% |
Demographics Similar to Immigrants from Spain by Master's Degree
In terms of master's degree, the demographic groups most similar to Immigrants from Spain are Immigrants from Bolivia (19.1%, a difference of 0.13%), Immigrants from Latvia (19.1%, a difference of 0.47%), Bolivian (19.3%, a difference of 0.64%), Immigrants from Saudi Arabia (19.0%, a difference of 0.91%), and Immigrants from Greece (19.0%, a difference of 0.92%).
| Demographics | Rating | Rank | Master's Degree |
| Burmese | 100.0 /100 | #32 | Exceptional 19.7% |
| Russians | 100.0 /100 | #33 | Exceptional 19.5% |
| Immigrants | Denmark | 100.0 /100 | #34 | Exceptional 19.5% |
| Immigrants | Northern Europe | 100.0 /100 | #35 | Exceptional 19.5% |
| Immigrants | Russia | 100.0 /100 | #36 | Exceptional 19.4% |
| Mongolians | 100.0 /100 | #37 | Exceptional 19.4% |
| Bolivians | 100.0 /100 | #38 | Exceptional 19.3% |
| Immigrants | Spain | 100.0 /100 | #39 | Exceptional 19.1% |
| Immigrants | Bolivia | 100.0 /100 | #40 | Exceptional 19.1% |
| Immigrants | Latvia | 100.0 /100 | #41 | Exceptional 19.1% |
| Immigrants | Saudi Arabia | 100.0 /100 | #42 | Exceptional 19.0% |
| Immigrants | Greece | 100.0 /100 | #43 | Exceptional 19.0% |
| Immigrants | Malaysia | 100.0 /100 | #44 | Exceptional 18.9% |
| Immigrants | Belarus | 100.0 /100 | #45 | Exceptional 18.9% |
| Immigrants | Norway | 100.0 /100 | #46 | Exceptional 18.8% |