Barbadian vs Immigrants from Spain Doctorate Degree
COMPARE
Barbadian
Immigrants from Spain
Doctorate Degree
Doctorate Degree Comparison
Barbadians
Immigrants from Spain
1.6%
DOCTORATE DEGREE
3.3/ 100
METRIC RATING
233rd/ 347
METRIC RANK
2.6%
DOCTORATE DEGREE
100.0/ 100
METRIC RATING
36th/ 347
METRIC RANK
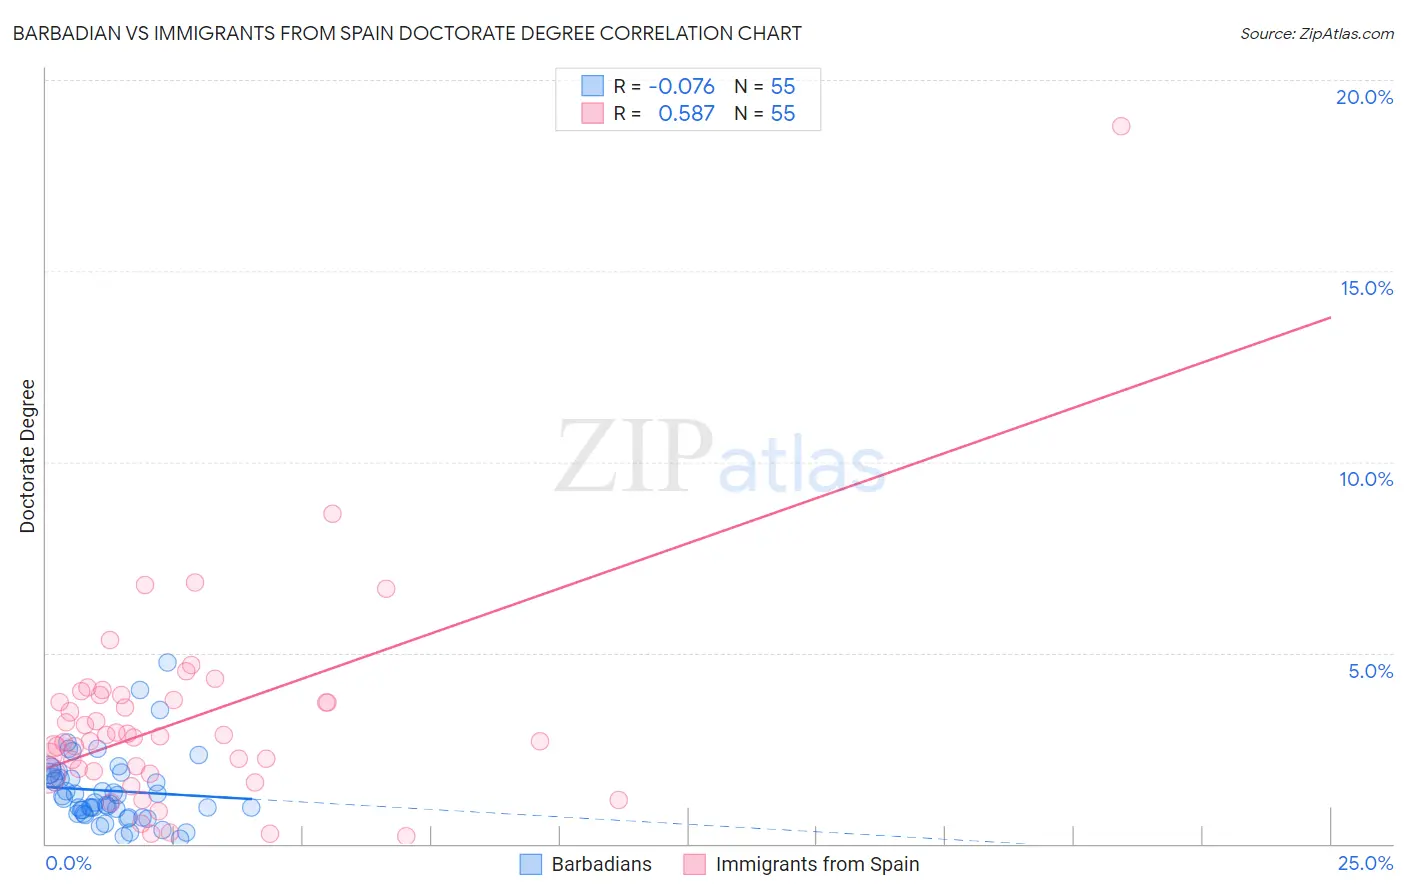
Barbadian vs Immigrants from Spain Doctorate Degree Correlation Chart
The statistical analysis conducted on geographies consisting of 140,930,059 people shows a slight negative correlation between the proportion of Barbadians and percentage of population with at least doctorate degree education in the United States with a correlation coefficient (R) of -0.076 and weighted average of 1.6%. Similarly, the statistical analysis conducted on geographies consisting of 238,840,570 people shows a substantial positive correlation between the proportion of Immigrants from Spain and percentage of population with at least doctorate degree education in the United States with a correlation coefficient (R) of 0.587 and weighted average of 2.6%, a difference of 59.1%.
Doctorate Degree Correlation Summary
| Measurement | Barbadian | Immigrants from Spain |
| Minimum | 0.13% | 0.19% |
| Maximum | 4.7% | 18.8% |
| Range | 4.6% | 18.6% |
| Mean | 1.4% | 3.2% |
| Median | 1.2% | 2.8% |
| Interquartile 25% (IQ1) | 0.80% | 1.9% |
| Interquartile 75% (IQ3) | 1.8% | 3.9% |
| Interquartile Range (IQR) | 1.1% | 2.0% |
| Standard Deviation (Sample) | 0.91% | 2.7% |
| Standard Deviation (Population) | 0.90% | 2.7% |
Similar Demographics by Doctorate Degree
Demographics Similar to Barbadians by Doctorate Degree
In terms of doctorate degree, the demographic groups most similar to Barbadians are Guamanian/Chamorro (1.6%, a difference of 0.070%), Hopi (1.6%, a difference of 0.15%), Cree (1.6%, a difference of 0.36%), Indonesian (1.6%, a difference of 0.64%), and Immigrants from North Macedonia (1.6%, a difference of 0.76%).
| Demographics | Rating | Rank | Doctorate Degree |
| Osage | 6.5 /100 | #226 | Tragic 1.7% |
| Panamanians | 6.3 /100 | #227 | Tragic 1.7% |
| Assyrians/Chaldeans/Syriacs | 5.9 /100 | #228 | Tragic 1.7% |
| Colville | 4.7 /100 | #229 | Tragic 1.6% |
| Immigrants | Philippines | 4.3 /100 | #230 | Tragic 1.6% |
| Immigrants | North Macedonia | 3.9 /100 | #231 | Tragic 1.6% |
| Guamanians/Chamorros | 3.3 /100 | #232 | Tragic 1.6% |
| Barbadians | 3.3 /100 | #233 | Tragic 1.6% |
| Hopi | 3.2 /100 | #234 | Tragic 1.6% |
| Cree | 3.0 /100 | #235 | Tragic 1.6% |
| Indonesians | 2.8 /100 | #236 | Tragic 1.6% |
| Iroquois | 2.7 /100 | #237 | Tragic 1.6% |
| Immigrants | Congo | 2.6 /100 | #238 | Tragic 1.6% |
| West Indians | 2.5 /100 | #239 | Tragic 1.6% |
| Immigrants | Panama | 2.4 /100 | #240 | Tragic 1.6% |
Demographics Similar to Immigrants from Spain by Doctorate Degree
In terms of doctorate degree, the demographic groups most similar to Immigrants from Spain are Immigrants from Malaysia (2.6%, a difference of 0.060%), Cypriot (2.6%, a difference of 0.12%), Cambodian (2.6%, a difference of 0.23%), Immigrants from Kuwait (2.6%, a difference of 0.26%), and Immigrants from Northern Europe (2.6%, a difference of 0.41%).
| Demographics | Rating | Rank | Doctorate Degree |
| Immigrants | South Central Asia | 100.0 /100 | #29 | Exceptional 2.6% |
| Immigrants | Korea | 100.0 /100 | #30 | Exceptional 2.6% |
| Latvians | 100.0 /100 | #31 | Exceptional 2.6% |
| Immigrants | Northern Europe | 100.0 /100 | #32 | Exceptional 2.6% |
| Cambodians | 100.0 /100 | #33 | Exceptional 2.6% |
| Cypriots | 100.0 /100 | #34 | Exceptional 2.6% |
| Immigrants | Malaysia | 100.0 /100 | #35 | Exceptional 2.6% |
| Immigrants | Spain | 100.0 /100 | #36 | Exceptional 2.6% |
| Immigrants | Kuwait | 100.0 /100 | #37 | Exceptional 2.6% |
| Russians | 100.0 /100 | #38 | Exceptional 2.6% |
| Immigrants | Ireland | 100.0 /100 | #39 | Exceptional 2.5% |
| Estonians | 100.0 /100 | #40 | Exceptional 2.5% |
| Immigrants | Russia | 100.0 /100 | #41 | Exceptional 2.5% |
| New Zealanders | 100.0 /100 | #42 | Exceptional 2.5% |
| Soviet Union | 100.0 /100 | #43 | Exceptional 2.5% |