Mongolian vs Immigrants from Spain Hearing Disability
COMPARE
Mongolian
Immigrants from Spain
Hearing Disability
Hearing Disability Comparison
Mongolians
Immigrants from Spain
2.7%
HEARING DISABILITY
97.4/ 100
METRIC RATING
78th/ 347
METRIC RANK
2.8%
HEARING DISABILITY
94.9/ 100
METRIC RATING
101st/ 347
METRIC RANK
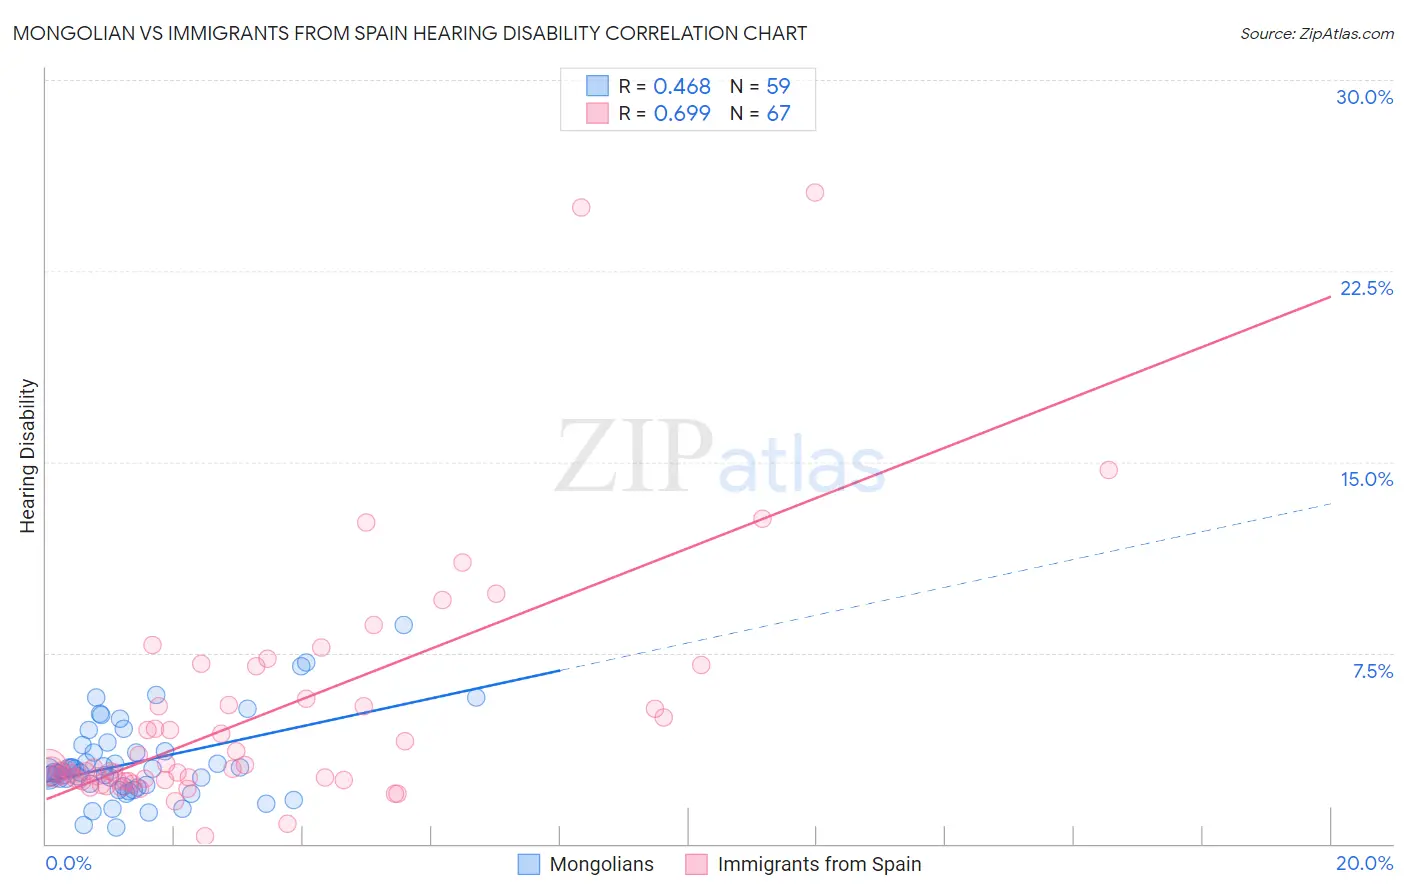
Mongolian vs Immigrants from Spain Hearing Disability Correlation Chart
The statistical analysis conducted on geographies consisting of 140,352,505 people shows a moderate positive correlation between the proportion of Mongolians and percentage of population with hearing disability in the United States with a correlation coefficient (R) of 0.468 and weighted average of 2.7%. Similarly, the statistical analysis conducted on geographies consisting of 239,646,131 people shows a significant positive correlation between the proportion of Immigrants from Spain and percentage of population with hearing disability in the United States with a correlation coefficient (R) of 0.699 and weighted average of 2.8%, a difference of 1.9%.
Hearing Disability Correlation Summary
| Measurement | Mongolian | Immigrants from Spain |
| Minimum | 0.63% | 0.32% |
| Maximum | 8.6% | 25.6% |
| Range | 8.0% | 25.3% |
| Mean | 3.2% | 4.9% |
| Median | 2.8% | 2.9% |
| Interquartile 25% (IQ1) | 2.3% | 2.5% |
| Interquartile 75% (IQ3) | 3.6% | 5.4% |
| Interquartile Range (IQR) | 1.4% | 2.9% |
| Standard Deviation (Sample) | 1.6% | 4.7% |
| Standard Deviation (Population) | 1.6% | 4.6% |
Similar Demographics by Hearing Disability
Demographics Similar to Mongolians by Hearing Disability
In terms of hearing disability, the demographic groups most similar to Mongolians are Colombian (2.7%, a difference of 0.020%), Immigrants from Malaysia (2.7%, a difference of 0.040%), Immigrants from Saudi Arabia (2.7%, a difference of 0.070%), Asian (2.7%, a difference of 0.070%), and Immigrants from Korea (2.7%, a difference of 0.090%).
| Demographics | Rating | Rank | Hearing Disability |
| Central Americans | 97.7 /100 | #71 | Exceptional 2.7% |
| Afghans | 97.6 /100 | #72 | Exceptional 2.7% |
| Argentineans | 97.5 /100 | #73 | Exceptional 2.7% |
| Immigrants | Korea | 97.5 /100 | #74 | Exceptional 2.7% |
| Immigrants | Saudi Arabia | 97.5 /100 | #75 | Exceptional 2.7% |
| Asians | 97.5 /100 | #76 | Exceptional 2.7% |
| Immigrants | Malaysia | 97.5 /100 | #77 | Exceptional 2.7% |
| Mongolians | 97.4 /100 | #78 | Exceptional 2.7% |
| Colombians | 97.4 /100 | #79 | Exceptional 2.7% |
| Immigrants | Asia | 97.2 /100 | #80 | Exceptional 2.7% |
| Immigrants | Uruguay | 97.2 /100 | #81 | Exceptional 2.7% |
| Immigrants | Armenia | 97.2 /100 | #82 | Exceptional 2.7% |
| Immigrants | Cuba | 97.2 /100 | #83 | Exceptional 2.7% |
| Immigrants | Argentina | 97.0 /100 | #84 | Exceptional 2.8% |
| Immigrants | Northern Africa | 96.9 /100 | #85 | Exceptional 2.8% |
Demographics Similar to Immigrants from Spain by Hearing Disability
In terms of hearing disability, the demographic groups most similar to Immigrants from Spain are Taiwanese (2.8%, a difference of 0.010%), Immigrants from Eastern Africa (2.8%, a difference of 0.050%), Immigrants from Indonesia (2.8%, a difference of 0.060%), Immigrants from Guatemala (2.8%, a difference of 0.11%), and Immigrants from Honduras (2.8%, a difference of 0.15%).
| Demographics | Rating | Rank | Hearing Disability |
| Uruguayans | 95.9 /100 | #94 | Exceptional 2.8% |
| Israelis | 95.9 /100 | #95 | Exceptional 2.8% |
| Immigrants | Somalia | 95.5 /100 | #96 | Exceptional 2.8% |
| Immigrants | Afghanistan | 95.3 /100 | #97 | Exceptional 2.8% |
| Immigrants | Honduras | 95.1 /100 | #98 | Exceptional 2.8% |
| Immigrants | Guatemala | 95.1 /100 | #99 | Exceptional 2.8% |
| Immigrants | Eastern Africa | 95.0 /100 | #100 | Exceptional 2.8% |
| Immigrants | Spain | 94.9 /100 | #101 | Exceptional 2.8% |
| Taiwanese | 94.8 /100 | #102 | Exceptional 2.8% |
| Immigrants | Indonesia | 94.7 /100 | #103 | Exceptional 2.8% |
| Burmese | 94.2 /100 | #104 | Exceptional 2.8% |
| Moroccans | 93.9 /100 | #105 | Exceptional 2.8% |
| Hondurans | 93.4 /100 | #106 | Exceptional 2.8% |
| Immigrants | Chile | 93.4 /100 | #107 | Exceptional 2.8% |
| Guatemalans | 93.2 /100 | #108 | Exceptional 2.8% |