Guatemalan vs Immigrants from Denmark Hearing Disability
COMPARE
Guatemalan
Immigrants from Denmark
Hearing Disability
Hearing Disability Comparison
Guatemalans
Immigrants from Denmark
2.8%
HEARING DISABILITY
93.2/ 100
METRIC RATING
108th/ 347
METRIC RANK
3.1%
HEARING DISABILITY
16.2/ 100
METRIC RATING
203rd/ 347
METRIC RANK
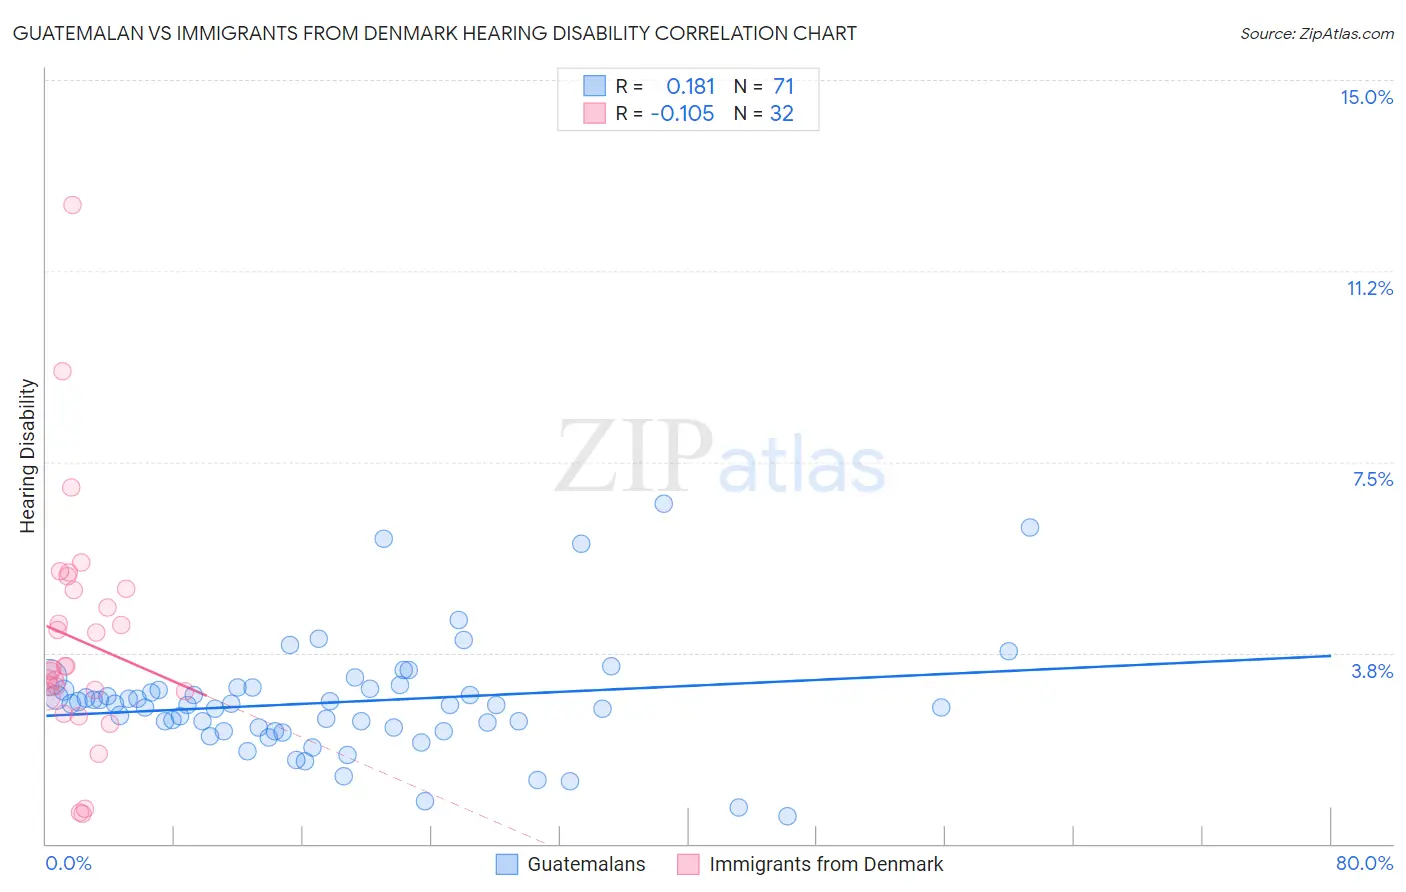
Guatemalan vs Immigrants from Denmark Hearing Disability Correlation Chart
The statistical analysis conducted on geographies consisting of 409,374,057 people shows a poor positive correlation between the proportion of Guatemalans and percentage of population with hearing disability in the United States with a correlation coefficient (R) of 0.181 and weighted average of 2.8%. Similarly, the statistical analysis conducted on geographies consisting of 136,425,612 people shows a poor negative correlation between the proportion of Immigrants from Denmark and percentage of population with hearing disability in the United States with a correlation coefficient (R) of -0.105 and weighted average of 3.1%, a difference of 10.6%.
Hearing Disability Correlation Summary
| Measurement | Guatemalan | Immigrants from Denmark |
| Minimum | 0.55% | 0.58% |
| Maximum | 6.7% | 12.5% |
| Range | 6.1% | 12.0% |
| Mean | 2.8% | 4.0% |
| Median | 2.7% | 3.5% |
| Interquartile 25% (IQ1) | 2.2% | 2.9% |
| Interquartile 75% (IQ3) | 3.0% | 5.0% |
| Interquartile Range (IQR) | 0.81% | 2.1% |
| Standard Deviation (Sample) | 1.1% | 2.4% |
| Standard Deviation (Population) | 1.1% | 2.3% |
Similar Demographics by Hearing Disability
Demographics Similar to Guatemalans by Hearing Disability
In terms of hearing disability, the demographic groups most similar to Guatemalans are Turkish (2.8%, a difference of 0.070%), Honduran (2.8%, a difference of 0.080%), Immigrants from Chile (2.8%, a difference of 0.080%), Cypriot (2.8%, a difference of 0.12%), and Immigrants from Yemen (2.8%, a difference of 0.17%).
| Demographics | Rating | Rank | Hearing Disability |
| Immigrants | Spain | 94.9 /100 | #101 | Exceptional 2.8% |
| Taiwanese | 94.8 /100 | #102 | Exceptional 2.8% |
| Immigrants | Indonesia | 94.7 /100 | #103 | Exceptional 2.8% |
| Burmese | 94.2 /100 | #104 | Exceptional 2.8% |
| Moroccans | 93.9 /100 | #105 | Exceptional 2.8% |
| Hondurans | 93.4 /100 | #106 | Exceptional 2.8% |
| Immigrants | Chile | 93.4 /100 | #107 | Exceptional 2.8% |
| Guatemalans | 93.2 /100 | #108 | Exceptional 2.8% |
| Turks | 93.0 /100 | #109 | Exceptional 2.8% |
| Cypriots | 92.9 /100 | #110 | Exceptional 2.8% |
| Immigrants | Yemen | 92.7 /100 | #111 | Exceptional 2.8% |
| U.S. Virgin Islanders | 92.5 /100 | #112 | Exceptional 2.8% |
| Immigrants | Belarus | 91.6 /100 | #113 | Exceptional 2.8% |
| Cambodians | 91.1 /100 | #114 | Exceptional 2.8% |
| Immigrants | Latin America | 90.5 /100 | #115 | Exceptional 2.8% |
Demographics Similar to Immigrants from Denmark by Hearing Disability
In terms of hearing disability, the demographic groups most similar to Immigrants from Denmark are Immigrants from Thailand (3.1%, a difference of 0.040%), Immigrants from Czechoslovakia (3.1%, a difference of 0.050%), Alsatian (3.1%, a difference of 0.050%), Eastern European (3.1%, a difference of 0.12%), and Hispanic or Latino (3.1%, a difference of 0.18%).
| Demographics | Rating | Rank | Hearing Disability |
| Immigrants | Europe | 22.9 /100 | #196 | Fair 3.1% |
| Immigrants | Bosnia and Herzegovina | 20.6 /100 | #197 | Fair 3.1% |
| Immigrants | Croatia | 20.5 /100 | #198 | Fair 3.1% |
| Syrians | 19.2 /100 | #199 | Poor 3.1% |
| Immigrants | North Macedonia | 19.1 /100 | #200 | Poor 3.1% |
| Iraqis | 19.0 /100 | #201 | Poor 3.1% |
| Immigrants | Thailand | 16.4 /100 | #202 | Poor 3.1% |
| Immigrants | Denmark | 16.2 /100 | #203 | Poor 3.1% |
| Immigrants | Czechoslovakia | 15.9 /100 | #204 | Poor 3.1% |
| Alsatians | 15.9 /100 | #205 | Poor 3.1% |
| Eastern Europeans | 15.5 /100 | #206 | Poor 3.1% |
| Hispanics or Latinos | 15.1 /100 | #207 | Poor 3.1% |
| Immigrants | Latvia | 12.7 /100 | #208 | Poor 3.1% |
| Immigrants | Hungary | 12.5 /100 | #209 | Poor 3.1% |
| Cape Verdeans | 12.2 /100 | #210 | Poor 3.1% |