Arab vs Immigrants from Denmark Hearing Disability
COMPARE
Arab
Immigrants from Denmark
Hearing Disability
Hearing Disability Comparison
Arabs
Immigrants from Denmark
3.0%
HEARING DISABILITY
57.6/ 100
METRIC RATING
169th/ 347
METRIC RANK
3.1%
HEARING DISABILITY
16.2/ 100
METRIC RATING
203rd/ 347
METRIC RANK
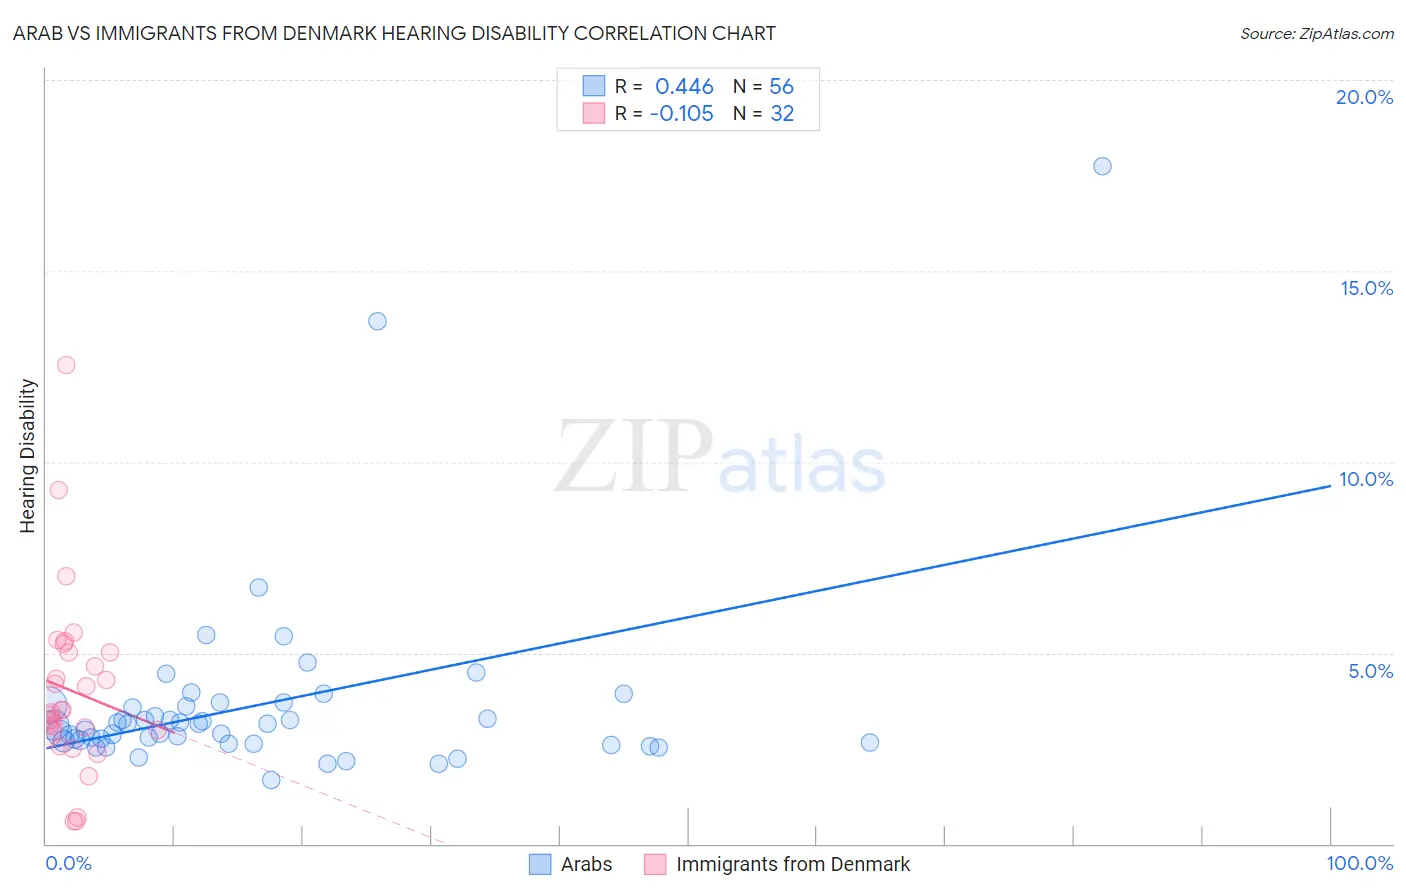
Arab vs Immigrants from Denmark Hearing Disability Correlation Chart
The statistical analysis conducted on geographies consisting of 486,579,834 people shows a moderate positive correlation between the proportion of Arabs and percentage of population with hearing disability in the United States with a correlation coefficient (R) of 0.446 and weighted average of 3.0%. Similarly, the statistical analysis conducted on geographies consisting of 136,425,612 people shows a poor negative correlation between the proportion of Immigrants from Denmark and percentage of population with hearing disability in the United States with a correlation coefficient (R) of -0.105 and weighted average of 3.1%, a difference of 4.6%.
Hearing Disability Correlation Summary
| Measurement | Arab | Immigrants from Denmark |
| Minimum | 1.7% | 0.58% |
| Maximum | 17.8% | 12.5% |
| Range | 16.1% | 12.0% |
| Mean | 3.6% | 4.0% |
| Median | 3.1% | 3.5% |
| Interquartile 25% (IQ1) | 2.7% | 2.9% |
| Interquartile 75% (IQ3) | 3.6% | 5.0% |
| Interquartile Range (IQR) | 0.96% | 2.1% |
| Standard Deviation (Sample) | 2.5% | 2.4% |
| Standard Deviation (Population) | 2.5% | 2.3% |
Similar Demographics by Hearing Disability
Demographics Similar to Arabs by Hearing Disability
In terms of hearing disability, the demographic groups most similar to Arabs are Immigrants from Greece (3.0%, a difference of 0.030%), Immigrants from Eastern Europe (3.0%, a difference of 0.040%), Immigrants from Cabo Verde (3.0%, a difference of 0.070%), Immigrants from Ukraine (3.0%, a difference of 0.10%), and Armenian (3.0%, a difference of 0.15%).
| Demographics | Rating | Rank | Hearing Disability |
| Immigrants | Japan | 66.3 /100 | #162 | Good 2.9% |
| Immigrants | Central America | 64.9 /100 | #163 | Good 3.0% |
| Immigrants | Cambodia | 64.8 /100 | #164 | Good 3.0% |
| Immigrants | Zimbabwe | 64.2 /100 | #165 | Good 3.0% |
| Immigrants | South Eastern Asia | 62.9 /100 | #166 | Good 3.0% |
| Immigrants | Eastern Europe | 58.1 /100 | #167 | Average 3.0% |
| Immigrants | Greece | 57.9 /100 | #168 | Average 3.0% |
| Arabs | 57.6 /100 | #169 | Average 3.0% |
| Immigrants | Cabo Verde | 56.9 /100 | #170 | Average 3.0% |
| Immigrants | Ukraine | 56.6 /100 | #171 | Average 3.0% |
| Armenians | 56.0 /100 | #172 | Average 3.0% |
| Immigrants | Serbia | 51.1 /100 | #173 | Average 3.0% |
| Indonesians | 50.0 /100 | #174 | Average 3.0% |
| Immigrants | Romania | 48.4 /100 | #175 | Average 3.0% |
| Panamanians | 47.0 /100 | #176 | Average 3.0% |
Demographics Similar to Immigrants from Denmark by Hearing Disability
In terms of hearing disability, the demographic groups most similar to Immigrants from Denmark are Immigrants from Thailand (3.1%, a difference of 0.040%), Immigrants from Czechoslovakia (3.1%, a difference of 0.050%), Alsatian (3.1%, a difference of 0.050%), Eastern European (3.1%, a difference of 0.12%), and Hispanic or Latino (3.1%, a difference of 0.18%).
| Demographics | Rating | Rank | Hearing Disability |
| Immigrants | Europe | 22.9 /100 | #196 | Fair 3.1% |
| Immigrants | Bosnia and Herzegovina | 20.6 /100 | #197 | Fair 3.1% |
| Immigrants | Croatia | 20.5 /100 | #198 | Fair 3.1% |
| Syrians | 19.2 /100 | #199 | Poor 3.1% |
| Immigrants | North Macedonia | 19.1 /100 | #200 | Poor 3.1% |
| Iraqis | 19.0 /100 | #201 | Poor 3.1% |
| Immigrants | Thailand | 16.4 /100 | #202 | Poor 3.1% |
| Immigrants | Denmark | 16.2 /100 | #203 | Poor 3.1% |
| Immigrants | Czechoslovakia | 15.9 /100 | #204 | Poor 3.1% |
| Alsatians | 15.9 /100 | #205 | Poor 3.1% |
| Eastern Europeans | 15.5 /100 | #206 | Poor 3.1% |
| Hispanics or Latinos | 15.1 /100 | #207 | Poor 3.1% |
| Immigrants | Latvia | 12.7 /100 | #208 | Poor 3.1% |
| Immigrants | Hungary | 12.5 /100 | #209 | Poor 3.1% |
| Cape Verdeans | 12.2 /100 | #210 | Poor 3.1% |