Barbadian vs Cheyenne Births to Unmarried Women
COMPARE
Barbadian
Cheyenne
Births to Unmarried Women
Births to Unmarried Women Comparison
Barbadians
Cheyenne
37.0%
BIRTHS TO UNMARRIED WOMEN
0.1/ 100
METRIC RATING
275th/ 347
METRIC RANK
41.3%
BIRTHS TO UNMARRIED WOMEN
0.0/ 100
METRIC RATING
325th/ 347
METRIC RANK
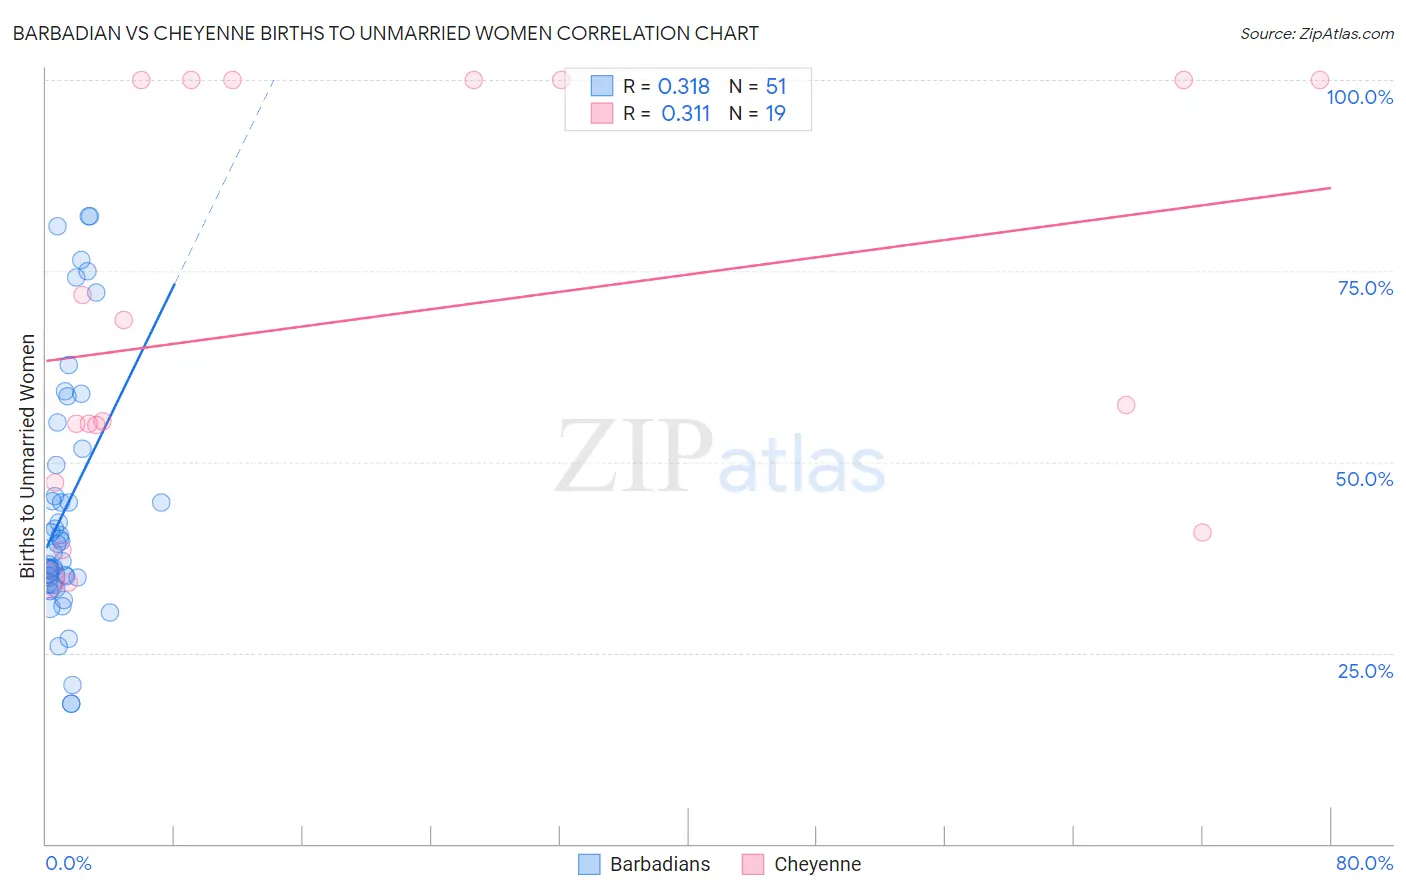
Barbadian vs Cheyenne Births to Unmarried Women Correlation Chart
The statistical analysis conducted on geographies consisting of 138,072,035 people shows a mild positive correlation between the proportion of Barbadians and percentage of births to unmarried women in the United States with a correlation coefficient (R) of 0.318 and weighted average of 37.0%. Similarly, the statistical analysis conducted on geographies consisting of 79,528,425 people shows a mild positive correlation between the proportion of Cheyenne and percentage of births to unmarried women in the United States with a correlation coefficient (R) of 0.311 and weighted average of 41.3%, a difference of 11.8%.
Births to Unmarried Women Correlation Summary
| Measurement | Barbadian | Cheyenne |
| Minimum | 18.3% | 34.1% |
| Maximum | 82.2% | 100.0% |
| Range | 63.9% | 65.9% |
| Mean | 44.0% | 69.1% |
| Median | 39.3% | 57.4% |
| Interquartile 25% (IQ1) | 34.1% | 47.3% |
| Interquartile 75% (IQ3) | 51.8% | 100.0% |
| Interquartile Range (IQR) | 17.7% | 52.7% |
| Standard Deviation (Sample) | 16.6% | 26.1% |
| Standard Deviation (Population) | 16.4% | 25.4% |
Similar Demographics by Births to Unmarried Women
Demographics Similar to Barbadians by Births to Unmarried Women
In terms of births to unmarried women, the demographic groups most similar to Barbadians are Cree (37.0%, a difference of 0.030%), Mexican (36.9%, a difference of 0.12%), Belizean (37.0%, a difference of 0.19%), Choctaw (36.9%, a difference of 0.23%), and Guatemalan (37.1%, a difference of 0.41%).
| Demographics | Rating | Rank | Births to Unmarried Women |
| Comanche | 0.1 /100 | #268 | Tragic 36.7% |
| Senegalese | 0.1 /100 | #269 | Tragic 36.8% |
| Immigrants | Congo | 0.1 /100 | #270 | Tragic 36.8% |
| Immigrants | Barbados | 0.1 /100 | #271 | Tragic 36.8% |
| Choctaw | 0.1 /100 | #272 | Tragic 36.9% |
| Mexicans | 0.1 /100 | #273 | Tragic 36.9% |
| Cree | 0.1 /100 | #274 | Tragic 37.0% |
| Barbadians | 0.1 /100 | #275 | Tragic 37.0% |
| Belizeans | 0.1 /100 | #276 | Tragic 37.0% |
| Guatemalans | 0.1 /100 | #277 | Tragic 37.1% |
| Immigrants | Latin America | 0.1 /100 | #278 | Tragic 37.1% |
| West Indians | 0.1 /100 | #279 | Tragic 37.3% |
| Immigrants | St. Vincent and the Grenadines | 0.1 /100 | #280 | Tragic 37.3% |
| Immigrants | Belize | 0.1 /100 | #281 | Tragic 37.3% |
| Liberians | 0.0 /100 | #282 | Tragic 37.4% |
Demographics Similar to Cheyenne by Births to Unmarried Women
In terms of births to unmarried women, the demographic groups most similar to Cheyenne are Cape Verdean (41.3%, a difference of 0.060%), Immigrants from Cuba (41.5%, a difference of 0.27%), Sioux (41.0%, a difference of 0.85%), Cajun (41.0%, a difference of 0.93%), and Bahamian (40.8%, a difference of 1.4%).
| Demographics | Rating | Rank | Births to Unmarried Women |
| Immigrants | Bahamas | 0.0 /100 | #318 | Tragic 40.1% |
| Yakama | 0.0 /100 | #319 | Tragic 40.3% |
| Crow | 0.0 /100 | #320 | Tragic 40.4% |
| Bahamians | 0.0 /100 | #321 | Tragic 40.8% |
| Cajuns | 0.0 /100 | #322 | Tragic 41.0% |
| Sioux | 0.0 /100 | #323 | Tragic 41.0% |
| Cape Verdeans | 0.0 /100 | #324 | Tragic 41.3% |
| Cheyenne | 0.0 /100 | #325 | Tragic 41.3% |
| Immigrants | Cuba | 0.0 /100 | #326 | Tragic 41.5% |
| Tsimshian | 0.0 /100 | #327 | Tragic 42.2% |
| Immigrants | Cabo Verde | 0.0 /100 | #328 | Tragic 42.2% |
| Paiute | 0.0 /100 | #329 | Tragic 42.5% |
| Chippewa | 0.0 /100 | #330 | Tragic 42.6% |
| Natives/Alaskans | 0.0 /100 | #331 | Tragic 43.0% |
| Kiowa | 0.0 /100 | #332 | Tragic 43.1% |