Barbadian vs U.S. Virgin Islander Male Disability
COMPARE
Barbadian
U.S. Virgin Islander
Male Disability
Male Disability Comparison
Barbadians
U.S. Virgin Islanders
11.2%
MALE DISABILITY
53.4/ 100
METRIC RATING
169th/ 347
METRIC RANK
11.9%
MALE DISABILITY
1.3/ 100
METRIC RATING
236th/ 347
METRIC RANK
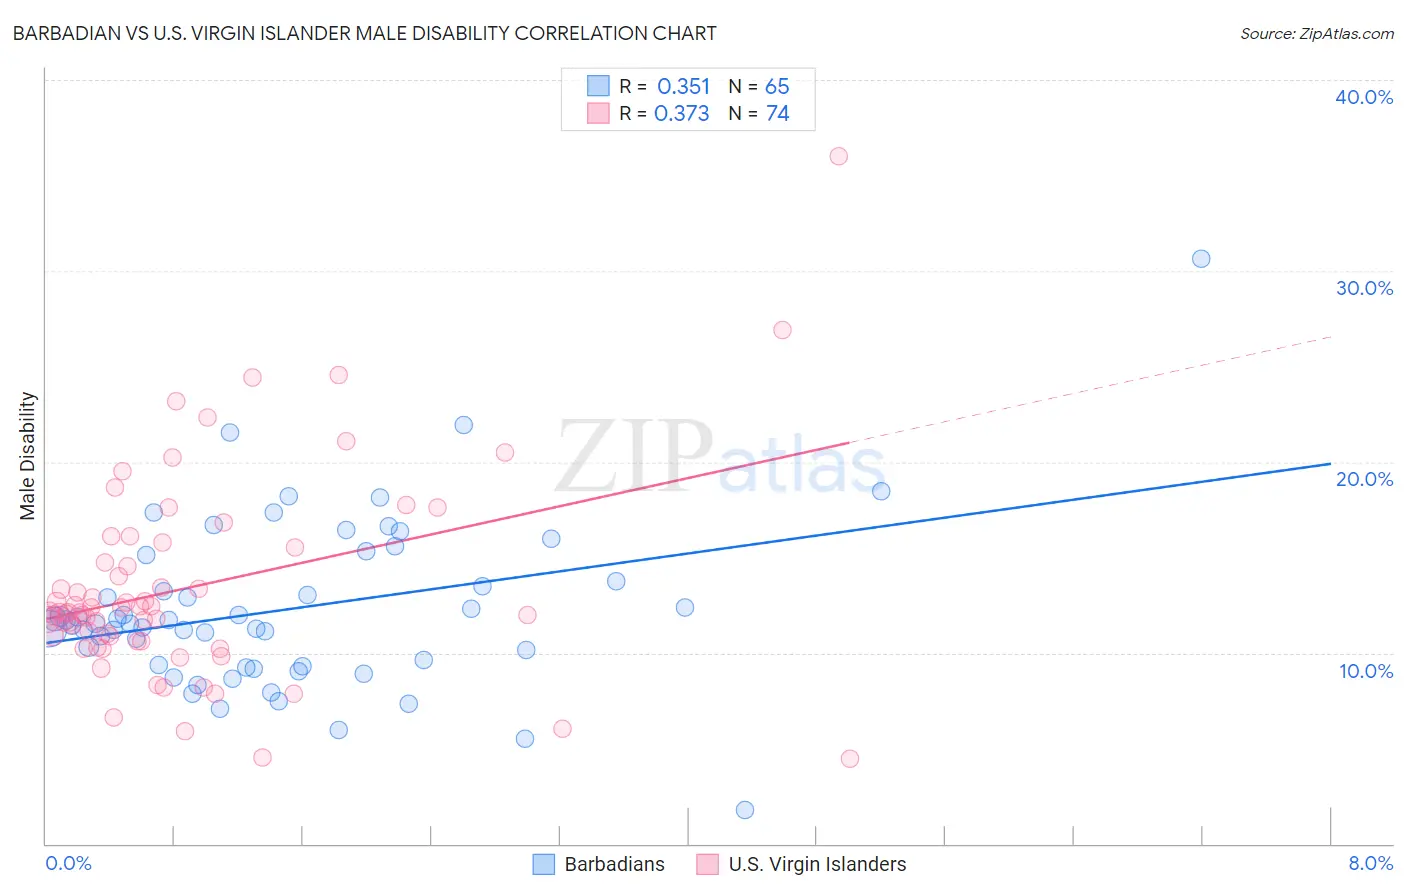
Barbadian vs U.S. Virgin Islander Male Disability Correlation Chart
The statistical analysis conducted on geographies consisting of 141,288,845 people shows a mild positive correlation between the proportion of Barbadians and percentage of males with a disability in the United States with a correlation coefficient (R) of 0.351 and weighted average of 11.2%. Similarly, the statistical analysis conducted on geographies consisting of 87,521,484 people shows a mild positive correlation between the proportion of U.S. Virgin Islanders and percentage of males with a disability in the United States with a correlation coefficient (R) of 0.373 and weighted average of 11.9%, a difference of 6.2%.
Male Disability Correlation Summary
| Measurement | Barbadian | U.S. Virgin Islander |
| Minimum | 1.8% | 4.4% |
| Maximum | 30.6% | 36.0% |
| Range | 28.8% | 31.6% |
| Mean | 12.3% | 13.4% |
| Median | 11.6% | 12.1% |
| Interquartile 25% (IQ1) | 9.3% | 10.6% |
| Interquartile 75% (IQ3) | 14.4% | 15.5% |
| Interquartile Range (IQR) | 5.1% | 4.9% |
| Standard Deviation (Sample) | 4.4% | 5.3% |
| Standard Deviation (Population) | 4.4% | 5.3% |
Similar Demographics by Male Disability
Demographics Similar to Barbadians by Male Disability
In terms of male disability, the demographic groups most similar to Barbadians are Immigrants from Latin America (11.2%, a difference of 0.030%), New Zealander (11.2%, a difference of 0.030%), Haitian (11.2%, a difference of 0.050%), Immigrants from Southern Europe (11.2%, a difference of 0.060%), and Romanian (11.2%, a difference of 0.15%).
| Demographics | Rating | Rank | Male Disability |
| Immigrants | Haiti | 65.3 /100 | #162 | Good 11.1% |
| Immigrants | Kenya | 63.8 /100 | #163 | Good 11.1% |
| British West Indians | 62.8 /100 | #164 | Good 11.1% |
| Luxembourgers | 61.9 /100 | #165 | Good 11.1% |
| Immigrants | Hungary | 61.2 /100 | #166 | Good 11.1% |
| Immigrants | Southern Europe | 54.4 /100 | #167 | Average 11.2% |
| Immigrants | Latin America | 54.0 /100 | #168 | Average 11.2% |
| Barbadians | 53.4 /100 | #169 | Average 11.2% |
| New Zealanders | 52.9 /100 | #170 | Average 11.2% |
| Haitians | 52.5 /100 | #171 | Average 11.2% |
| Romanians | 50.7 /100 | #172 | Average 11.2% |
| Immigrants | Burma/Myanmar | 50.4 /100 | #173 | Average 11.2% |
| Maltese | 50.0 /100 | #174 | Average 11.2% |
| Immigrants | Honduras | 48.7 /100 | #175 | Average 11.2% |
| Syrians | 46.6 /100 | #176 | Average 11.2% |
Demographics Similar to U.S. Virgin Islanders by Male Disability
In terms of male disability, the demographic groups most similar to U.S. Virgin Islanders are Carpatho Rusyn (11.9%, a difference of 0.010%), Yugoslavian (11.9%, a difference of 0.11%), Immigrants from North America (11.9%, a difference of 0.14%), Italian (11.9%, a difference of 0.16%), and Czech (11.9%, a difference of 0.21%).
| Demographics | Rating | Rank | Male Disability |
| Bermudans | 2.3 /100 | #229 | Tragic 11.8% |
| Croatians | 2.1 /100 | #230 | Tragic 11.8% |
| Dominicans | 1.8 /100 | #231 | Tragic 11.8% |
| Malaysians | 1.8 /100 | #232 | Tragic 11.8% |
| Mexicans | 1.7 /100 | #233 | Tragic 11.8% |
| Immigrants | Canada | 1.6 /100 | #234 | Tragic 11.9% |
| Immigrants | North America | 1.5 /100 | #235 | Tragic 11.9% |
| U.S. Virgin Islanders | 1.3 /100 | #236 | Tragic 11.9% |
| Carpatho Rusyns | 1.3 /100 | #237 | Tragic 11.9% |
| Yugoslavians | 1.2 /100 | #238 | Tragic 11.9% |
| Italians | 1.2 /100 | #239 | Tragic 11.9% |
| Czechs | 1.1 /100 | #240 | Tragic 11.9% |
| Bahamians | 1.1 /100 | #241 | Tragic 11.9% |
| Northern Europeans | 1.1 /100 | #242 | Tragic 11.9% |
| Samoans | 1.1 /100 | #243 | Tragic 11.9% |